Tracy Profiler

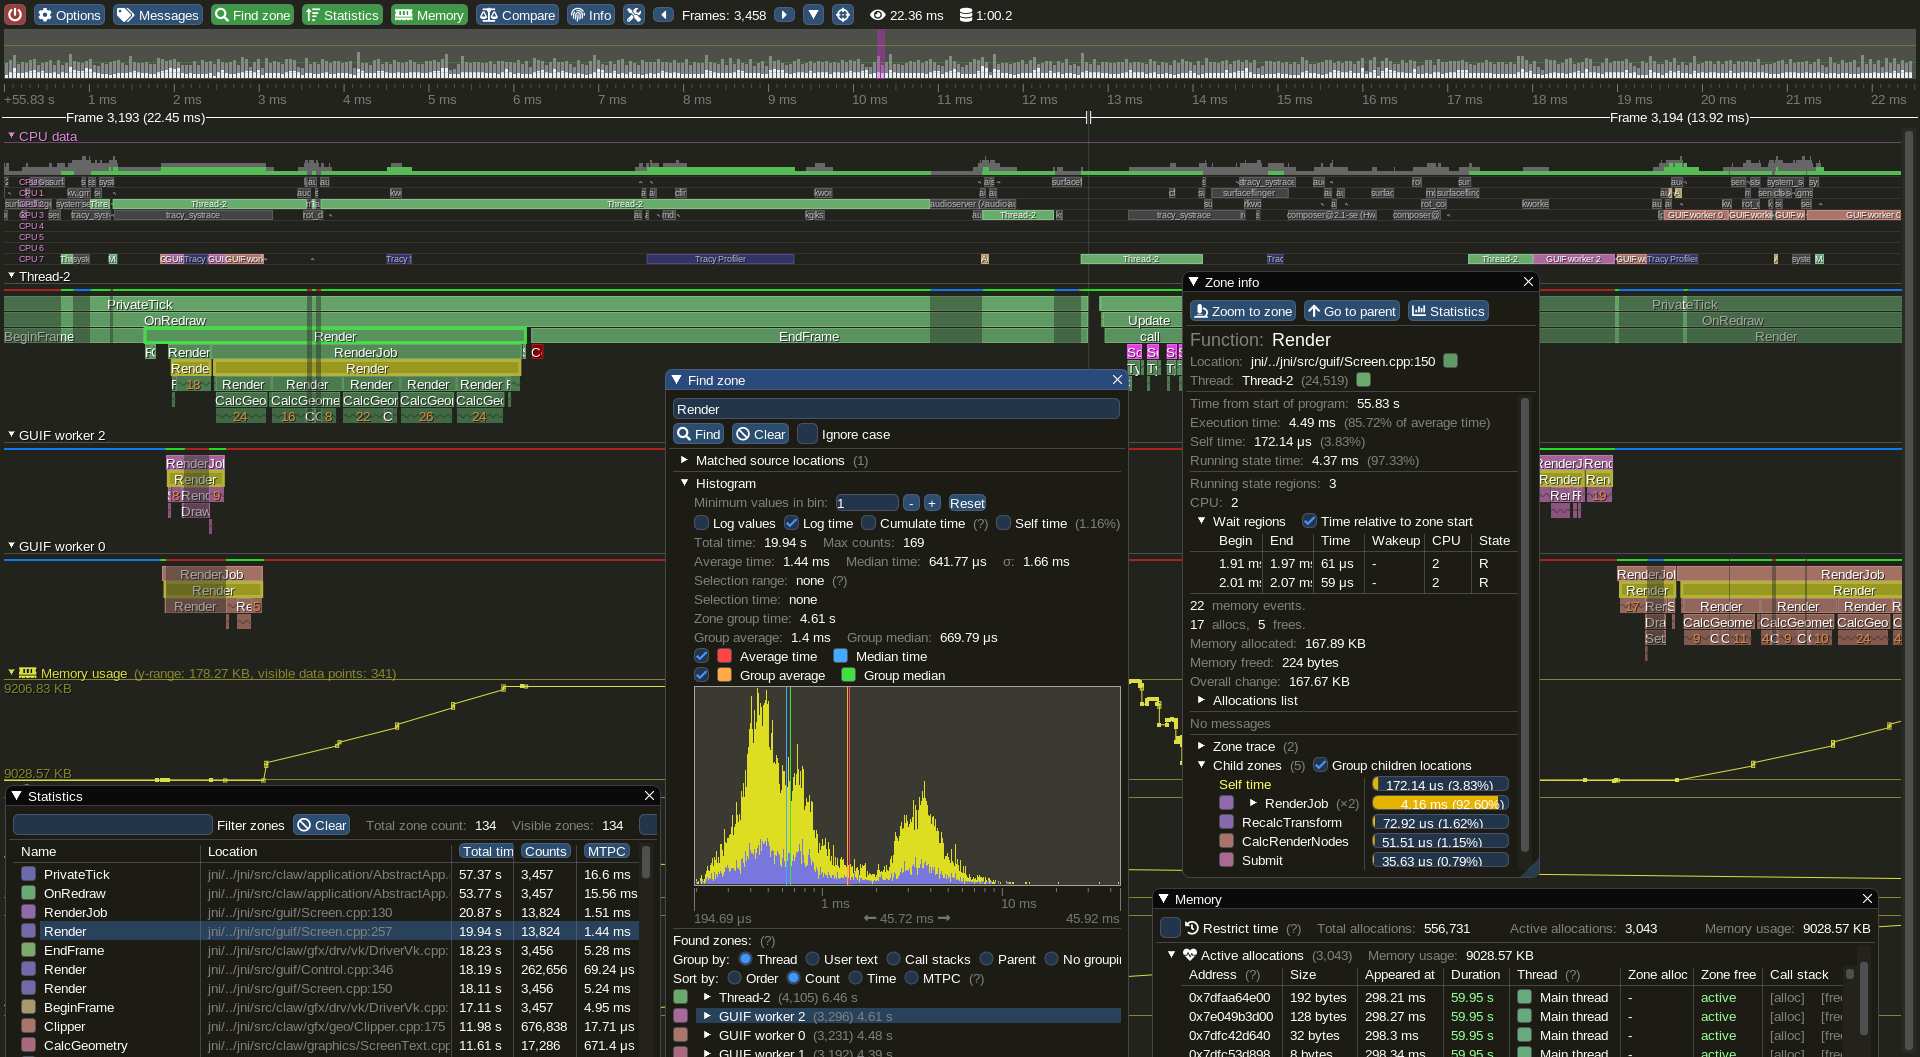
Tracy is a real-time, nanosecond resolution hybrid frame and sampling profiler that can be used for remote or embedded telemetry of games and other applications. It can profile CPU (C, C++11, Lua), GPU (OpenGL, Vulkan, Direct3D 11/12, OpenCL) and memory. It also can monitor locks held by threads and show where contention does happen.
While Tracy can perform statistical analysis of sampled call stack data, just like other statistical profilers (such as VTune, perf or Very Sleepy), it mainly focuses on manual markup of the source code, which allows frame-by-frame inspection of the program execution. You will be able to see exactly which functions are called, how much time is spent in them, and how do they interact with each other in a multi-threaded environment. In contrast, the statistical analysis may show you the hot spots in your code, but it is unable to accurately pinpoint the underlying cause for semi-random frame stutter that may occur every couple of seconds.
Even though Tracy targets frame profiling, with the emphasis on analysis of frame time in real-time applications (i.e. games), it does work with utilities that do not employ the concept of a frame. There’s nothing that would prohibit profiling of, for example, a compression tool, or an event-driven UI application.
You may think of Tracy as the RAD Telemetry plus Intel VTune, on overdrive.
https://github.com/wolfpld/tracy
You can see an interactive demo of Tracy Profiler in your browser.