What is a context switch? Link to heading
In computing, a context switch is the process of storing the state of a process or thread, so that it can be restored and resume execution at a later point. This allows multiple processes to share a single central processing unit (CPU), and is an essential feature of a multitasking operating system.
When you are profiling an application, measuring the time of execution of your functions will give you only a partial insight into the program performance. This is because the application may be temporarily paused by the OS, either due to the pressure exerted by other jobs running concurrently on the system or due to making a system call, which may put the code to sleep while the results are prepared.
A profiler will want to monitor the context switch behavior and present this information to the user to get the full picture. The video clip below clearly shows the benefits you get from having such data.
Now, there are some things to consider here:
- To access this data, you need to interact with the kernel monitoring facilities directly.
- Each operating system has its own scheduler implementation and its own tracing infrastructure.
- The target audience of this API is extremely limited.
- The data may expose secret information (e.g., what other programs are running), so you need to gain elevated privileges.
- You need to do all the processing in real-time, or the old information will be lost. Buffers, especially in the kernel space, are limited in size.
If you cannot see where this is all going, then maybe the article titled “The Worst API Ever Made” will give you a hint. This article describes how context switch data can be retrieved on Windows using Event Tracing for Windows (ETW). It is a fascinating read and probably the only clear source of knowledge on making this actually work. Unfortunately, it also forgets to mention a thing or two, which is understandable, considering the length of the text.
The Worst Four Non-APIs Ever Made Link to heading
Now, if you employ logic to reason about this section’s title, you may think that on Linux, you need to use four different APIs to monitor context switches. Oh no, no, no, don’t be silly! Linux actually gives you at least four different ways to do the same thing. Also, not one of them is adequately documented or supported. Moreover, these APIs are, in fact, Non-APIs, quite literally. If you dig deep enough, you will find out that they rely on this or that kernel ABI data structure, which may change at any time.
Function Tracer Link to heading
Let’s start with the kernel ftrace framework. How can we learn how to use it?
[21:03 wolf@ymir:~/linux]% du -sh Documentation/trace
796K    Documentation/trace
If this feels like a good start, I have some bad news for you. Much of this is just a distraction, which gives you a headache and nausea instead of knowledge. The most helpful document is ftrace.txt, which I encourage you to take a look at. If you understand nothing from this wall of text, then I don’t blame you.
The summary of things to do is as follows. First, you need to have the ftrace framework included in your kernel1. You also have to have the tracefs filesystem mounted somewhere2. Due to security reasons, to access this filesystem, you need to be running as root.
The trace filesystem provides a myriad of files, which you can use to configure tracing to your needs. I have found out that the following configuration works rather reliably:
- Write
0totracing_on. - Write
noptocurrent_tracer. - Write
norecord-cmd,norecord-tgid,noirq-info,noannotatetotrace_options. - Write
x86-tsc(ormono_rawon non-x86) totrace_clock. - Write
1toevents/sched/sched_switch/enableandevents/sched/sched_wakeup/enable. - Write
4096tobuffer_size_kb. - Finally, write
1totracing_onto get things going.
With these options, you should get the results with relatively little noise. Well, unless someone made changes to the configuration before you used it3. You can probably read the ftrace.txt document to see how to reset all defaults, but kernel APIs are not stable, so more options, which you would not be handling, might be added in the future.
The context switch data can be read in real-time from the trace_pipe file in the trace filesystem. The contents are in text format and look as follows:
<idle>-0       [001]  1074114830845446: sched_switch: prev_comm=swapper/1 prev_pid=0 prev_prio=120 prev_state=R ==> next_comm=kworker/u16:0 next_pid=428188 next_prio=120
 <...>-428188  [001]  1074114831008120: sched_switch: prev_comm=kworker/u16:0 prev_pid=428188 prev_prio=120 prev_state=I ==> next_comm=swapper/1 next_pid=0 next_prio=120
<idle>-0       [004]  1074115001164390: sched_wakeup: comm=khugepaged pid=79 prio=139 target_cpu=004
<idle>-0       [004]  1074115001199256: sched_switch: prev_comm=swapper/4 prev_pid=0 prev_prio=120 prev_state=R ==> next_comm=khugepaged next_pid=79 next_prio=139
 <...>-79      [004]  1074115001230144: sched_switch: prev_comm=khugepaged prev_pid=79 prev_prio=139 prev_state=S ==> next_comm=swapper/4 next_pid=0 next_prio=120
<idle>-0       [001]  1074115001280890: sched_switch: prev_comm=swapper/1 prev_pid=0 prev_prio=120 prev_state=R ==> next_comm=kworker/u16:0 next_pid=428188 next_prio=120
 <...>-428188  [001]  1074115001296708: sched_switch: prev_comm=kworker/u16:0 prev_pid=428188 prev_prio=120 prev_state=I ==> next_comm=swapper/1 next_pid=0 next_prio=120
You can parse these lines and extract the CPU core number (value in square brackets), the timestamp4, the type of event (context switch, or thread wakeup5), the before and after PIDs, and the process state (running, sleeping, waiting for I/O to finish…)
The obvious problem here is that you have to do text parsing to convert the data into a format usable by the machine. So, for example, while the kernel was working very hard to print the timestamp into a readable representation, now you have to burn even more cycles to undo this work. Furthermore, while writing this parser, you need to predict all the possible current and future inputs. Finally, remember that the data format is not documented in any place, so whatever you expect it to be may as well change relatively soon.
The not-so-visible problem is that you need to read this file through, well, file I/O infrastructure. Doing so involves multiple syscalls and can be pretty inefficient. And if you want to run this on Android, you have to spawn an external process with elevated privileges and pass the obtained data to the parent application.
If you read the documentation closely enough, you will notice three exciting options: raw, hex, and bin. These change how the data is formatted and should make the parsing work more straightforward, right? No, of course not. This is how the hex output looks like:
0000042e 00000006 0003da980889add6 type: 318
00000000 00000002 0003da9811c14432 type: 320
00000000 00000002 0003da9811c1b780 type: 318
000688ab 00000002 0003da9811c1f864 type: 318
00000000 00000006 0003da98166f9940 type: 320
00000000 00000006 0003da98166fee54 type: 318
0000042e 00000006 0003da981672a92a type: 318
00000000 00000007 0003da981b72bebe type: 320
You can see the CPU id, the timestamp, and the event type. But the second half of the data is missing. Where is it? Did somebody steal it? Your guess is as good as mine. I tried to reach out to the ftrace maintainers to figure out what was happening, but they completely ignored me.
Since there are multiple layers of small inefficiencies everywhere, this solution, while usable, is not recommended. If you want to probe for some additional data, like call stacks, then this whole scheme can no longer process the data in time.
perf_event_open Link to heading
The perf_event_open syscall interface documentation is another wall of text. While easier to read than the ftrace API, it is still vastly undocumented. Better something than nothing, right? Sure, but wait until you learn how it came to be.
The
perf_eventkernel API is poorly documented. The developers themselves do not always seem inclined to update the documentation. Since I have to muck around in the low-level interface, I’ve been putting what I’ve learned into this document.This is based on the files “tools/perf/design.txt” and “include/linux/perf_event.h” in the Linux kernel tree, as well as the
perfcode and libpfm4 code.
Yes, you read that right. The documentation was not created by the API authors but by someone who needed to use it.
So, how do you use it? Thankfully, it’s not that hard, especially if you have everything laid out in front of you. First, you create an instance of the perf_event_attr struct and fill it out with the appropriate data6. Then you do call the perf_event_open syscall with the suitable parameters.
 static int perf_event_open( struct perf_event_attr* attr, pid_t pid, int cpu, int group_fd, unsigned long flags )
 {
     return syscall( __NR_perf_event_open, attr, pid, cpu, group_fd, flags );
 }
The call returns a file descriptor for you to use, or -1 if something goes wrong7. As outlined in the manual page, the file descriptor should be used to mmap a ring buffer memory region. Then you have to write an implementation of said ring buffer to talk with the kernel. Yes, write, as there are no standard bug-free implementations of this functionality readily available. Who would need such a thing?
For reference, here is the ring buffer implementation used by the Tracy Profiler (with some less critical code omitted):
template<size_t Size>
class RingBuffer
{
public:
    RingBuffer( int fd )
        : m_fd( fd )
    {
        const auto pageSize = uint32_t( getpagesize() );
        assert( Size >= pageSize );
        assert( __builtin_popcount( Size ) == 1 );
        m_mapSize = Size + pageSize;
        auto mapAddr = mmap( nullptr, m_mapSize, PROT_READ | PROT_WRITE, MAP_SHARED, fd, 0 );
        m_metadata = (perf_event_mmap_page*)mapAddr;
        assert( m_metadata->data_offset == pageSize );
        m_buffer = ((char*)mapAddr) + pageSize;
        m_tail = m_metadata->data_tail;
    }

    ~RingBuffer()
    {
        if( m_metadata ) munmap( m_metadata, m_mapSize );
        if( m_fd ) close( m_fd );
    }

    void Enable() { ioctl( m_fd, PERF_EVENT_IOC_ENABLE, 0 ); }

    void Read( void* dst, uint64_t offset, uint64_t cnt )
    {
        auto src = ( m_tail + offset ) % Size;
        if( src + cnt <= Size )
        {
            memcpy( dst, m_buffer + src, cnt );
        }
        else
        {
            const auto s0 = Size - src;
            memcpy( dst, m_buffer + src, s0 );
            memcpy( (char*)dst + s0, m_buffer, cnt - s0 );
        }
    }

    void Advance( uint64_t cnt )
    {
        m_tail += cnt;
        StoreTail();
    }

    uint64_t LoadHead() const
    {
        return std::atomic_load_explicit( (const volatile std::atomic<uint64_t>*)&m_metadata->data_head, std::memory_order_acquire );
    }

    uint64_t GetTail() const { return m_tail; }

private:
    void StoreTail()
    {
        std::atomic_store_explicit( (volatile std::atomic<uint64_t>*)&m_metadata->data_tail, m_tail, std::memory_order_release );
    }

    uint64_t m_tail;
    char* m_buffer;
    perf_event_mmap_page* m_metadata;

    size_t m_mapSize;
    int m_fd;
};
And here is an example of how you can use it:
ring.Enable();
for(;;)
{
    const auto head = ring.LoadHead();
    const auto tail = ring.GetTail();
    if( head == tail ) continue;
    const auto end = head - tail;
    uint64_t pos = 0;
    while( pos < end )
    {
        perf_event_header hdr;
        ring.Read( &hdr, pos, sizeof( perf_event_header ) );
        switch( hdr.type )
        {
            ...
        }
        pos += hdr.size;
    }
    ring.Advance( end );
}
With this tiny detail out of the way, we will now see what the API can do. And it will be in three different variants.
The context_switch option Link to heading
context_switch (since Linux 4.3)
This enables the generation of PERF_RECORD_SWITCH records when a context switch occurs. It also enables the generation of PERF_RECORD_SWITCH_CPU_WIDE records when sampling in CPU-wide mode. This functionality is in addition to existing tracepoint and software events for measuring context switches. The advantage of this method is that it will give full information even with strict perf_event_paranoid settings.
Unfortunately, these records do not contain the full information. Both the PERF_RECORD_SWITCH and the PERF_RECORD_SWITCH_CPU_WIDE structs can only provide the information for the current process. If you want to retrieve system-wide data, then you’re out of luck here.
The PERF_COUNT_SW_CONTEXT_SWITCHES event Link to heading
PERF_COUNT_SW_CONTEXT_SWITCHES
This counts context switches. Until Linux 2.6.34, these were all reported as user-space events, after that they are reported as happening in the kernel.
With this one, I haven’t bothered too much, as the data it provides is not documented in any way. Maybe it is only used to count the events for you to query the number at a later time8?
The PERF_TYPE_TRACEPOINT type Link to heading
If type is
PERF_TYPE_TRACEPOINT, then we are measuring kernel tracepoints. The value to use inconfigcan be obtained from under debugfstracing/events/*/*/idif ftrace is enabled in the kernel.
Ah yes, the unholy union of perf_event_open with ftrace. Spoiler alert, this is the one that actually works as advertised. Unfortunately, you still have to run with elevated privileges to query the tracepoint identifiers9. As I understand it, these values are system-dependent and shouldn’t be hardcoded.
The perf_event_attr struct can be configured as follows:
pe = {};
pe.type = PERF_TYPE_TRACEPOINT;
pe.size = sizeof( perf_event_attr );
pe.sample_period = 1;
pe.sample_type = PERF_SAMPLE_TIME | PERF_SAMPLE_RAW;
pe.disabled = 1;
pe.inherit = 1;
pe.config = sched_switch_id;
To sum this up: we are sampling each event (sample_period of 1) of the tracepoint sched_switch, the identifier of which we have read from the /sys/kernel/debug/tracing/events/sched/sched_switch/id file. We want our samples to include the timestamp and the raw tracepoint data. We also set the inherit option to include events in all child threads we will spawn in the future10. We keep the tracer disabled during the setup phase. We will enable it later.
Ok, so let’s see how to parse the data. The switch( hdr.type ) section was left empty in the code snippet above, and we will now provide its contents.
...
switch( hdr.type )
{
case PERF_RECORD_SAMPLE:
{
    // Layout:
    //   u64 time
    //   u32 size
    //   u8  data[size]

    auto offset = pos + sizeof( perf_event_header );
    uint64_t time;
    ring.Read( &time, offset, sizeof( uint64_t ) );
    offset += sizeof( uint64_t );

    // Handle the data buffer

    break;
}
default:
    break;
}
...
The data layout can be inferred by comparing the manual page against the set of enabled sample_type options.
struct {
    struct perf_event_header header;
    u64    sample_id;   /* if PERF_SAMPLE_IDENTIFIER */
    u64    ip;          /* if PERF_SAMPLE_IP */
    u32    pid, tid;    /* if PERF_SAMPLE_TID */
    u64    time;        /* if PERF_SAMPLE_TIME */
    ...
    u32    size;        /* if PERF_SAMPLE_RAW */
    char   data[size];  /* if PERF_SAMPLE_RAW */
    ...
};
Here the sample_id, ip, pid, tid fields are not present, as we have not requested retrieval of PERF_SAMPLE_IDENTIFIER, PERF_SAMPLE_IP, nor PERF_SAMPLE_TID data.
We, however, requested the time, and it can be read from the ring buffer using the correct offset. The timestamp value is reported using an internal kernel clock, and you have to convert it to a usable time base. There are two different ways to perform such fixup of the time value. The first one requires enabling the use_clockid option in the perf_event_attr struct and setting the clockid parameter, e.g., to CLOCK_MONOTONIC_RAW. The second one requires manual conversion to the TSC register base. You can find the proper math for this operation on the manual page:
If
cap_usr_time_zerois set11, then the hardware clock (the TSC timestamp counter on x86) can be calculated from thetime_zero,time_mult, andtime_shiftvalues:time = timestamp - time_zero; quot = time / time_mult; rem = time % time_mult; cyc = (quot << time_shift) + (rem << time_shift) / time_mult;
Ok, and what about the tracepoint data obtained through PERF_SAMPLE_RAW? Ahaha, screw you, that’s what! Remember when I told you this is a Non-API? Here’s what the documentation says:
This RAW record data is opaque with respect to the ABI. The ABI doesn’t make any promises with respect to the stability of its content, it may vary depending on event, hardware, and kernel version.
At this point, your best bet is to print out the contents of the buffers you are receiving and sit down with a pen and a curious mind.
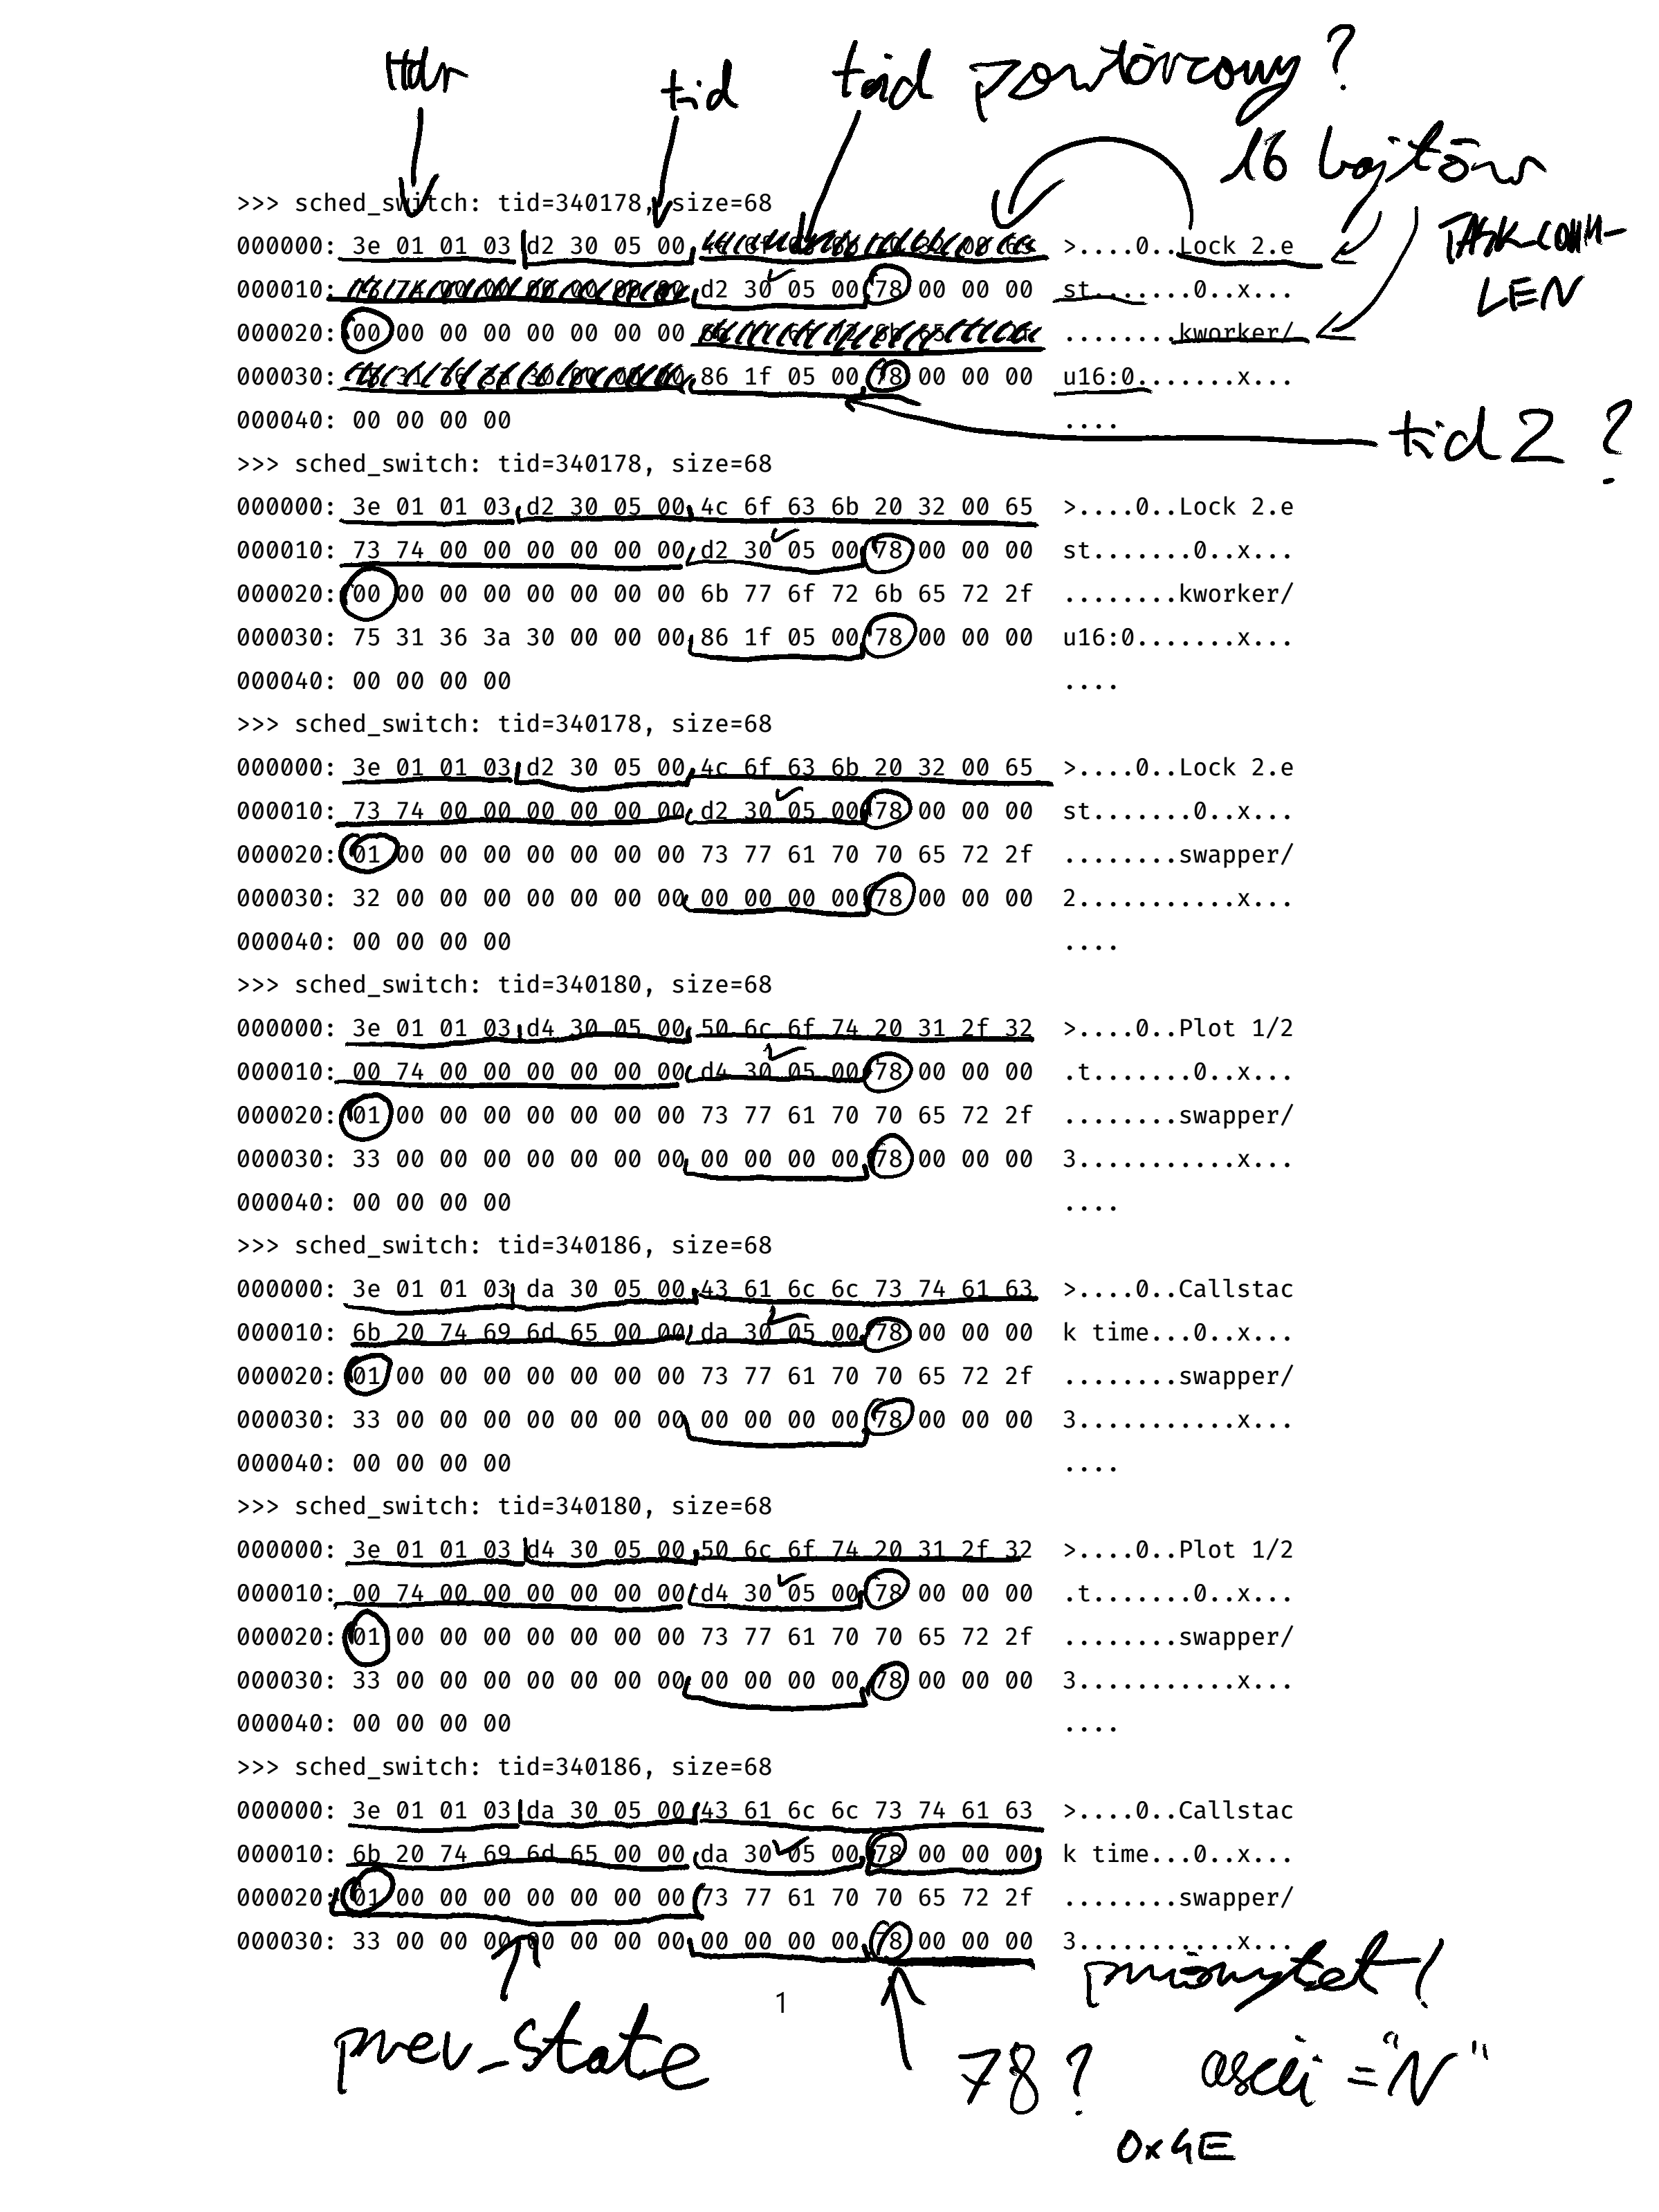
There certainly is some valid data here, some of which you can guess out, but what about this 78 byte? What does it indicate? Or the 01 byte, which sometimes is 00? To make sense of it, you must download the Linux kernel sources, where you will find the layout defined in the include/trace/events/sched.h file12.
TRACE_EVENT(sched_switch,

    TP_STRUCT__entry(
            __array(        char,   prev_comm,      TASK_COMM_LEN   )
            __field(        pid_t,  prev_pid                        )
            __field(        int,    prev_prio                       )
            __field(        long,   prev_state                      )
            __array(        char,   next_comm,      TASK_COMM_LEN   )
            __field(        pid_t,  next_pid                        )
            __field(        int,    next_prio                       )
    ),
We can match this struct to what we have seen in the buffer printout, starting at offset 8. The first bytes in the buffer are then some header, which we can skip. This layout is, of course, not guaranteed to be valid in the future, but it hasn’t been changed even once since kernel developers added it back in 2009. Anyways, the missing buffer processing code follows:
// Layout:
//   u64 time
//   u32 size
//   u8  data[size]
// Data:
//   u8  hdr[8]
//   u8  prev_comm[16]
//   u32 prev_pid
//   u32 prev_prio
//   lng prev_state
//   u8  next_comm[16]
//   u32 next_pid
//   u32 next_prio

offset += sizeof( perf_event_header ) + sizeof( uint64_t ) + sizeof( int32_t ) + 8 + 16;

uint32_t prev_pid, next_pid;
long prev_state;

ring.Read( &prev_pid, offset, sizeof( uint32_t ) );
offset += sizeof( uint32_t ) + sizeof( uint32_t );
ring.Read( &prev_state, offset, sizeof( long ) );
offset += sizeof( long ) + 16;
ring.Read( &next_pid, offset, sizeof( uint32_t ) );

uint8_t state;
if(      prev_state & 0x0001 ) state = 104;
else if( prev_state & 0x0002 ) state = 101;
else if( prev_state & 0x0004 ) state = 105;
else if( prev_state & 0x0008 ) state = 106;
else if( prev_state & 0x0010 ) state = 108;
else if( prev_state & 0x0020 ) state = 109;
else if( prev_state & 0x0040 ) state = 110;
else if( prev_state & 0x0080 ) state = 102;
else                           state = 103;
We now have the prev_pid, next_pid, and prev_state values13, which previously were retrieved by parsing ftrace output. An extra decoding step of prev_state to state mirrors the following Linux code:
(__entry->prev_state & (TASK_REPORT_MAX - 1)) ?
    __print_flags(__entry->prev_state & (TASK_REPORT_MAX - 1), "|",
                { TASK_INTERRUPTIBLE, "S" },
                { TASK_UNINTERRUPTIBLE, "D" },
                { __TASK_STOPPED, "T" },
                { __TASK_TRACED, "t" },
                { EXIT_DEAD, "X" },
                { EXIT_ZOMBIE, "Z" },
                { TASK_PARKED, "P" },
                { TASK_DEAD, "I" }) :
    "R",
We can repeat the same process to find out the layout of sched_wakeup data buffer.
Retrieving the CPU core identifier Link to heading
We still have work to do, as we don’t know on which CPU any context switch has occurred. But, if you were observant, you surely noticed that one of the flags we can pass to the sample_type option is PERF_SAMPLE_CPU. This flag enables reporting the CPU core identifier in the ring buffer event data. Of course, we can use this, but it makes no sense to do it this way.
The documentation to the perf_event_open syscall describes all the possible combinations of the pid and cpu arguments. It states that it is impossible to monitor all the processes on the system across all CPU cores with a single ring buffer. Instead, you can either monitor one process across all cores or monitor all processes just on one core.
Since we want to get the context switch data system-wide, we must resort to the second option. We will have to make the perf_event_open call for each CPU core we want to monitor and create the accompanying ring buffers. And if we have a separate ring buffer for each core, we already know which CPU core is providing the data without the kernel having to say this to us.
Looping over all created ring buffers to gather data is trivial and is left as an exercise for the reader. Or is it?
Preventing time travel Link to heading
There is a fundamental problem with how the raw data is collected and how we want to build data structures. The per-CPU ring buffers store events linearly, as they happen on each core. Yet, we are interested not in the CPU core timeline but the thread flow across cores.
If we would resort to using a simple processing loop, i.e., gather all events from CPU 0, then gather all events from CPU 1, and so on, we would not be getting coherent data at the thread level. Sure, it may be acceptable to sort the timestamps after the profiling has finished, but what if you want to present the data in real-time, just as they appear? Well, then you get something like this:
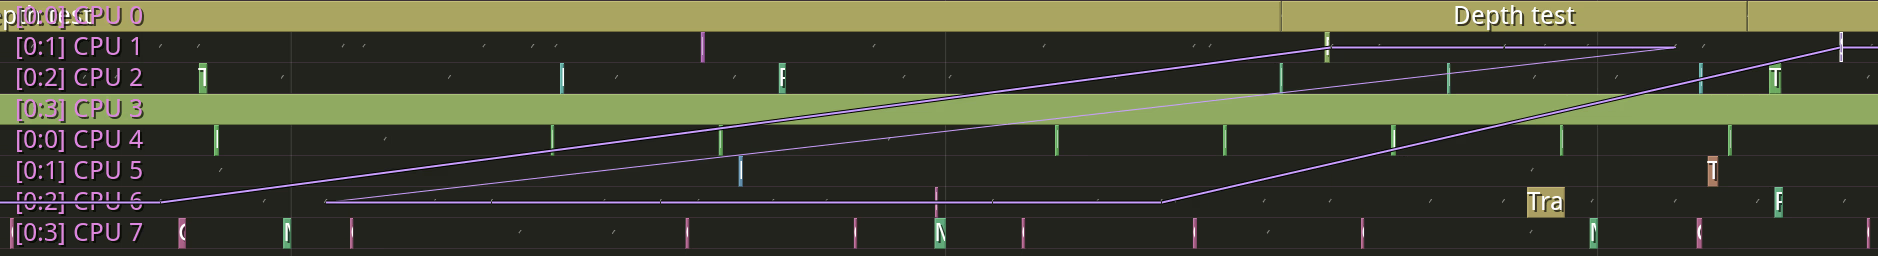
The violet line shows the migrations of a thread between CPU cores. This line should never go back in time, but it does. To fix this, you need to take a “snapshot” of all ring buffer contents14.
int activeNum = 0;
bool active[cpuCount];
uint32_t end[cpuCount];
uint32_t pos[cpuCount];
for( int i=0; i<cpuCount; i++ )
{
    const auto head = ring[i].LoadHead();
    const auto tail = ring[i].GetTail();

    active[i] = head != tail;
    if( active[i] )
    {
        activeNum++;
        end[i] = head - tail;
        pos[i] = 0;
    }
    else
    {
        end[i] = 0;
    }
}
Basically, we check which buffers have data waiting to be processed and save this information in the active array. We also set the pos and end iterators. With this ready, we can now probe the active buffers to see which one holds the earliest event:
while( activeNum > 0 )
{
    int sel = -1;
    int64_t minTime = std::numeric_limits<int64_t>::max();
    for( int i=0; i<cpuCount; i++ )
    {
        if( !active[i] ) continue;
        int64_t time;
        ring[i].Read( &time, pos[i] + sizeof( perf_event_header ), sizeof( int64_t ) );
        if( time < minTime )
        {
            minTime = time;
            sel = i;
        }
    }
    if( sel >= 0 )
    {
        // Process single event from a buffer
        // ...

        // Then update the iterator
        pos[sel] += hdr.size;
        if( pos[sel] == end[sel] )
        {
            active[sel] = false;
            activeNum--;
        }
    }
}
When all the buffers have been emptied, we need to mark that the data was processed:
for( int i=0; i<cpuCount; i++ )
{
    if( end[i] != 0 ) ring[i].Advance( end[i] );
}
And that’s about it. This is what you need to do to gather context switch data on Linux.
Conclusion Link to heading
As you can see, the Linux kernel is working hard to be hostile to you. The kernel developers seemingly can’t see the world outside their own bubble. There is no push to document or stabilize things15. There is no one to help you with the problems you have. If you think this context switch monitoring mess is terrible, then I have even better money quote straight from the horse’s mouth:
I don’t like debuggers. (…) I don’t think kernel development should be “easy”. I do not condone single-stepping through code to find the bug. I do not think that extra visibility into the system is necessarily a good thing.
And if this does not scare you off, you should know that the most recent resource on developing Linux kernel, the Linux Device Drivers book, was released in 2005 and was not updated since then.
The Linux kernel internals are constantly changing. By design. The most recent documentation of the matter is 16 years old.
How sustainable is this development model? What does happen when Torvalds retires? He’s almost 52 now, and he’s not getting any younger. Are there any true hackers left working on the kernel, or do corporations purely develop it now?
This may be problematic, as support for this functionality is not seen as necessary. No one is using it, remember? ↩︎
The usual path for this is
/sys/kernel/debug/tracing, but it may as well be different. To be fully compliant, you should probably be parsing the filesystem mount paths. ↩︎Or even, is using the interface simultaneously with you, which I’m sure has hilarious effects. There is of course no protocol to verify if it is safe for your program to use the ftrace infrastructure. No, you can’t check the
tracing_onvalue. A program may enable it and then never reset it due to a crash, lack of cleanup, or whatever other reason. ↩︎The example shows raw TSC readings, which are fully accurate. However, if you would need to use the
CLOCK_MONOTONIC_RAWclock16, the readings would be clamped to microsecond accuracy. ↩︎We need to monitor both
sched_switchandsched_wakeupevents to measure latency in the scheduler itself. ↩︎As you have probably figured out, this is the hard part. ↩︎
This feels like a good place to quote the manual page to give you a good measure of how well this is designed. EINVAL – Returned if the specified event is invalid. There are many possible reasons for this. A not-exhaustive list: sample_freq is higher than the maximum setting; the cpu to monitor does not exist; read_format is out of range; sample_type is out of range; the flags value is out of range; exclusive or pinned set and the event is not a group leader; the event config values are out of range or set reserved bits; the generic event selected is not supported; or there is not enough room to add the selected event. ↩︎
There are two ways to handle the performance data. The first one is counting. You check the value of some variable at, let’s say, the beginning and end of the program execution. You can calculate how many context switches happened in the run time from the difference. We are not interested in this mode of operation. The second mode is sampling, where you capture each event, such as a context switch, as it happens17. ↩︎
It feels like such a letdown. You can configure the system to allow unprivileged users to capture the data of interest (by setting
/proc/sys/kernel/perf_event_paranoidvalue to-1), but you still need a way to access this one identifier, which possibly may change once in a blue moon. ↩︎Threads that already exist won’t be inherited. You should setup sampling as early as possible. ↩︎
This is an essential condition to check, as the value may be momentarily unavailable for whatever unexplained reason. ↩︎
The Linux code base is at 1.25 GB now. In this lucky case, the results could be found quickly, because the layout was stored right next to the
printfsequence used by ftrace to providetrace_piperesults:"prev_comm=%s prev_pid=%d prev_prio=%d prev_state=%s%s ==> next_comm=%s next_pid=%d next_prio=%d". ↩︎The
prev_statevariable was incorrectly read as a 64-bit integer in this article before. It has been corrected to read the size of alongon 14.02.2022. ↩︎As we are not doing any locking here18, the data we get may still be malformed. There’s not much we can do about this other than try to minimize the impact. ↩︎
The kernel internals are in constant flux. This makes life that much harder if you want to build out-of-tree kernel modules. Like ordinary people usually do, when they want to have efficient 3D acceleration on their desktop19. Bash Microsoft all you want, but their kernel APIs are stable. ↩︎
It is interesting to notice that only the x86-specific Time Stamp Counter register is available to select here. If you wanted to have context switch capture on ARM, you couldn’t use a similar
cntvctregister because the API does not expose it. And if you use this register in all other places in code, but you cannot here, you cannot sync the two different clocks. Consequently, you have to useCLOCK_MONOTONIC_RAWeverywhere, which has a measurable impact on performance. I have measured the difference on one system, where a single reading ofcntvctregister took 83 µs, but calling theclock_gettimefunction took 135 µs. ↩︎There are just too many events to even consider such an approach in some cases. The count of assembly instructions executed by the processor is an example of such an event. However, this can be handled by performing sampling operations once every million or so events. ↩︎
And how could we? That would require locking the scheduler by a userspace program! ↩︎
To add insult to injury, Torvalds will make fun out of you if you still use the text console: Maybe there are people who haven’t jumped on the whole GUI bandwagon yet, and think it’s just a fad. ↩︎