
Is this the real life? Is this just fantasy?
Some time ago, Ivan Molodetskikh wrote a blog post about measuring the latency of various terminal emulators. In particular, Ivan wrote about using the Teensy microcontroller and how it can communicate with a computer over the USB cable. I thought it was an interesting topic and something I could reasonably do even though I don’t know anything about microcontrollers.1
Microcontroller Link to heading
In my mind, a microcontroller was some 8-bit chip for which you had to write a program in assembly, which was then flashed to the eeprom using a special device. It turns out that today’s microcontroller can be an ARM core running at 600 MHz, with 1 MB of RAM, hardware floating point support, a few megabytes of flash ROM, multiple USB interfaces, or even an Ethernet port. And you can program it in modern C++.
Is that a bit too much? Sure. Both Ivan’s post and Tristan Hume’s similar blog entry talk about using the Teensy LC, a simpler and cheaper microcontroller.2 The catch is that it’s out of stock and won’t be made available again, because the chips used in it are obsolete and no longer being manufactured. So, the beefy Teensy 4.x it is.3 Here’s how it looks compared to a lighter.4
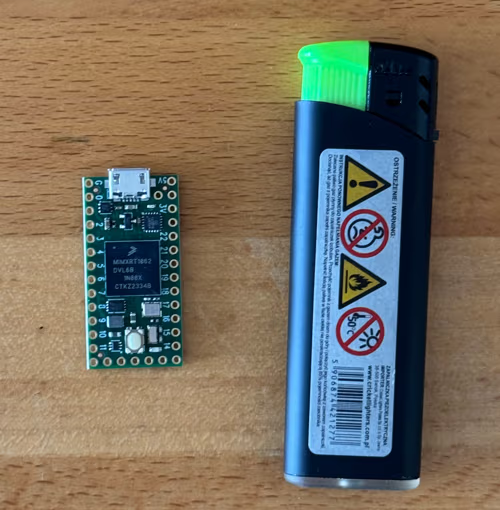
Teensy 4.0
Teensy is powered by 5V, which you can get from a USB cable. Internally it runs on 3.3V, and it requires that the voltage on all data pins be no higher than that. You have to be careful, or you could fry the microcontroller.
Programming the thing Link to heading
The microcontroller can be programmed using the Arduino IDE. It is a heavily modified VS Code, with almost all functionality stripped down.
The program you write will typically need to do some initial configuration at power up, such as specifying how the chip pinouts are used, or initializing external devices. Then it enters a loop where you do whatever you want over and over again.
The basic development cycle is: You compile the program, flash it to the microcontroller via a USB cable, and then you can, for example, view your runtime data or debug output on the serial port monitor built-in into the editor. It’s as simple as pressing F5, and the IDE does the rest for you.
All hardware specific APIs you will use are described with many usage examples on the Teensy website.
Latency tester Link to heading
To make a latency tester, you need to emulate a USB keyboard with the microcontroller, and measure the time elapsed from “pressing” a key to the screen content changing. How exactly would you get a sensor to detect that the monitor display has been updated,5 how does it work? Tristan links to a module available on Amazon. The price is quite high, and with shipping the cost is almost double.
I took a close look at this board, and… it’s just a photoresistor, a basic part you can get very cheaply at any local electronics store. There’s also an op-amp to convert the analog reading into a digital on-off signal, and a variable resistor to fine-tune the threshold. You don’t need that. You also don’t want the two light-emitting diodes in your light-measuring sensor that the module has.6
The photoresistor sensor you want to make is essentially a voltage divider made by putting two resistors in series. One of these resistors changes its resistance depending on the amount of light it receives, and this changes the division ratio, causing the voltage to go up and down, which you can measure.
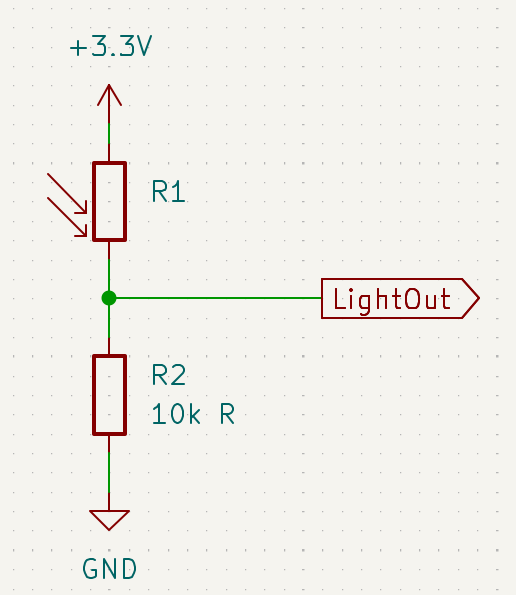
It’s really that simple
I built a module with this exact circuit, and sure enough it worked as expected. Analog readings with the microcontroller gave me the light values in the 0-1 range. This makes it very easy to detect when the state changes, and there are ready-to-use timer libraries to determine how much time has passed.
void setup() {
  Serial.begin(38400);
}

void loop() {
  Serial.println(analogRead(A0));
  delay(500);
}
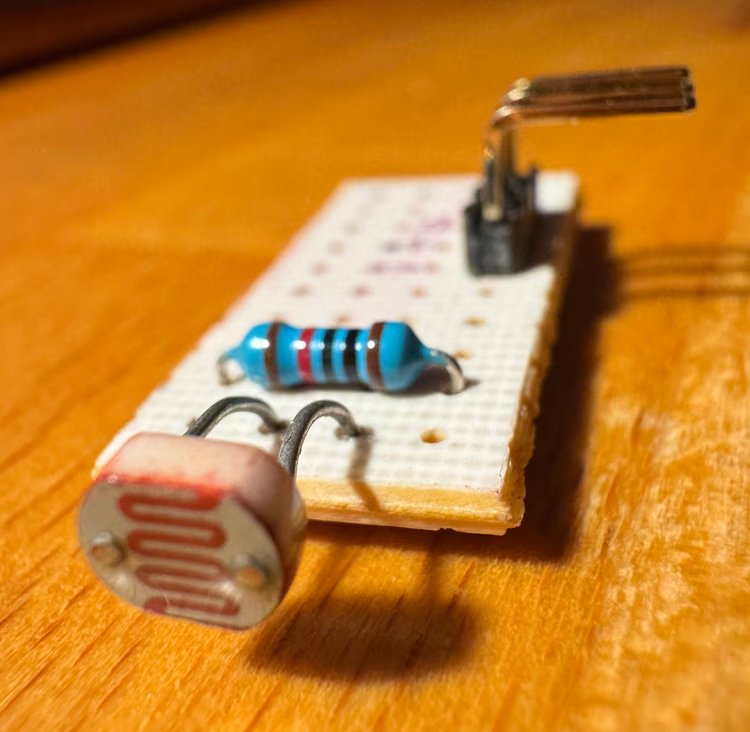
Light sensing module
With that done, I knew I could make it all work. The only thing left was some programming. But programming is relatively boring, and I have no immediate need to measure latency, so I stopped there with this particular project.
Analog vs digital Link to heading
It’s interesting to consider that there are two “approaches” to doing electronics engineering. What are the implications of going one way versus the other?
Most people will probably just do things digitally and be happy with what they get. All you have to do is connect some pins of two chips with a bunch of cables. And it all works, you can do interesting things with it, so everything is great, right? And most of the parts you’d want are available as modules that you can just plug in without thinking too much. Even the most basic things, like the photoresistor I talked about above, or even just a simple LED.
But you’re still just connecting a few wires.
Going analog is the hard way. You start with the basics, you learn what each part does, and how they can be used together to build more advanced things. You build and analyze simple circuits that do very surprising things. And it all costs almost nothing, really.
Say you want to make a LED blink. Do you need a Raspberry Pi, or some microcontroller to do that, because all you can do is putting things together with some wires? How about making a multivibrator instead,7 for literally a few cents?
Or how about making an inexpensive “clapper” light switch? Or amplifying the electromagnetic spectrum so you can hear how your chargers work, or how much radiation your microwave is emitting? Or doing some signal processing to isolate certain audio frequencies? Or…
Peripherals Link to heading
For some time now I wanted to have an air quality monitor, but everything on the market was crap in one way or another. I wanted to be able to monitor particulate matter (PM) and CO₂ levels, have an eink display and some kind of a graph showing the past readings. No such device exists, except maybe for one product, but even that does not do exactly what I want.
I was looking forward to maybe doing something that would satisfy my needs, so when I ordered the microcontroller, I also ordered a bunch of other components.
CO₂ sensor Link to heading
To measure the carbon dioxide levels I chose a sensor module from DFRobot, which cost ~300 zł. The device can also provide temperature and humidity readings.
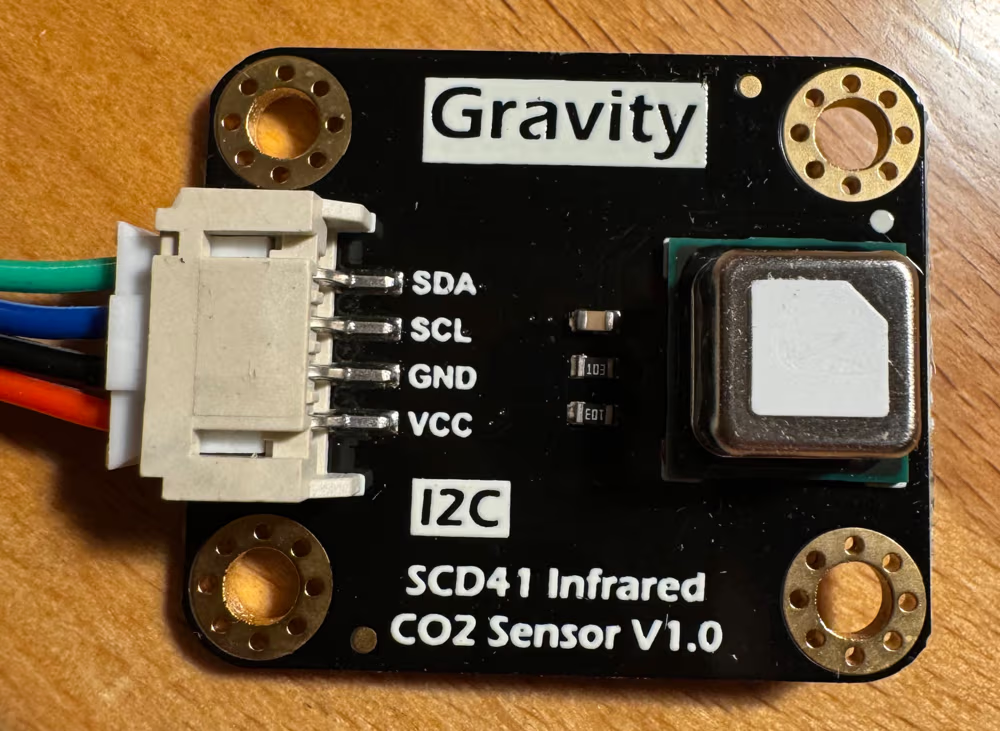
SCD41 module
This module uses the SCD41 sensor from Sensiron. The sensor on its own is about half the price of the module (120-160 zł). The module adds the two required pull-up resistors and a socket to which wires can easily be connected. The added fee for this basically nothing is a robbery in broad daylight, but otherwise you’d have to do some expert level soldering. See pages 5, 24 and 26 of the sensor datasheet for details on that.
Later, I was talking to a friend about this and he asked me why I hadn’t checked out AliExpress. Well, now I have, and, damn it.
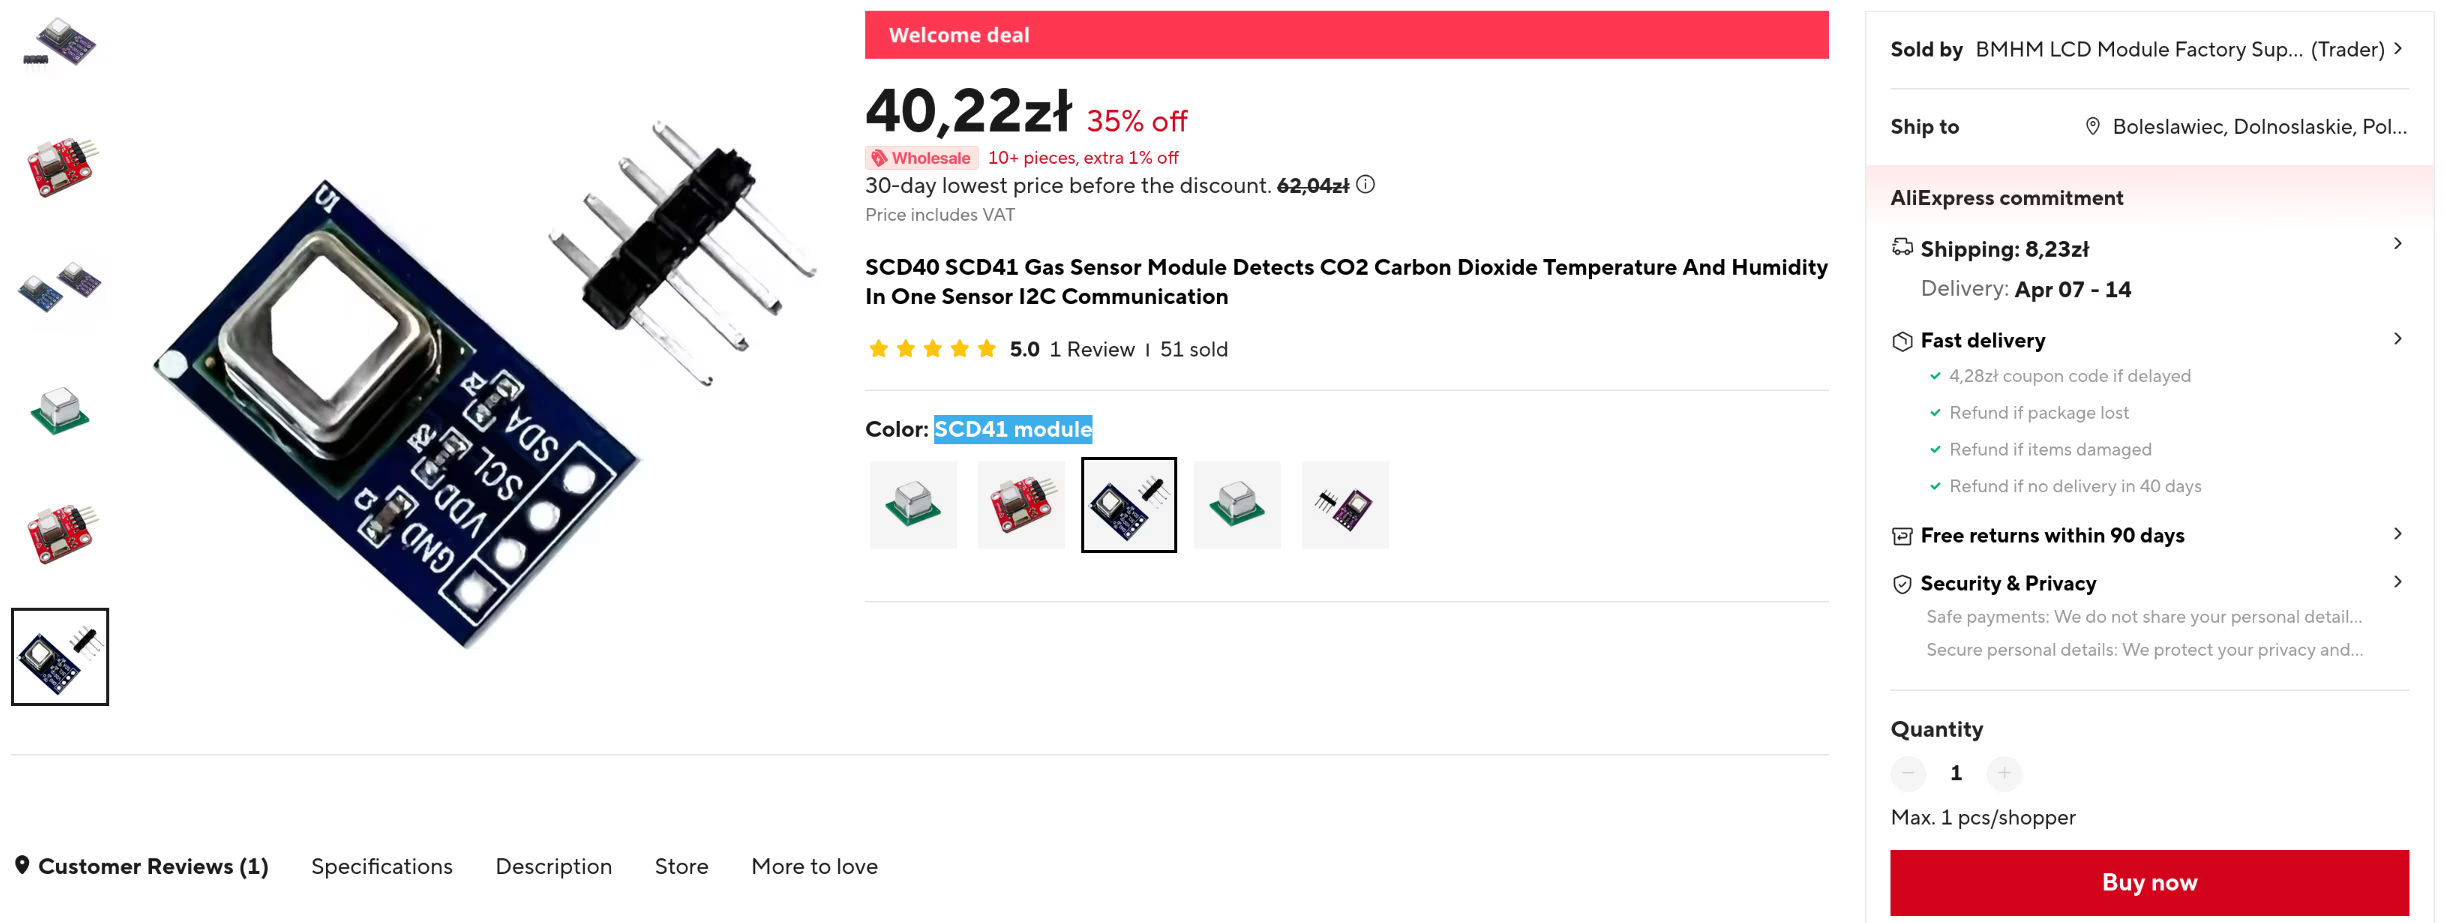
It’s the same exact thing, but at a much lower price and with longer shipping times
Another nitpick: the wire connector on the DFRobot module is on the wrong side. You want to expose the sensor to the outside world from whatever package you’re going to put your finished device in, but it’s hard to do that when there’s a socket in the way. The AliExpress PCB gives you a lot more flexibility to do this.
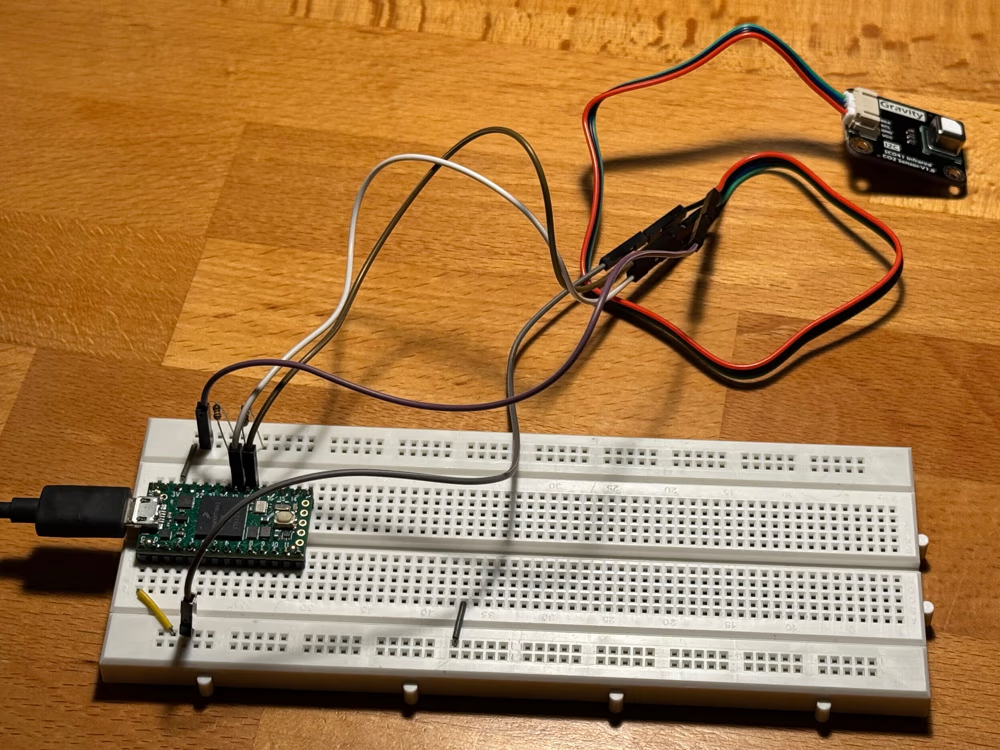
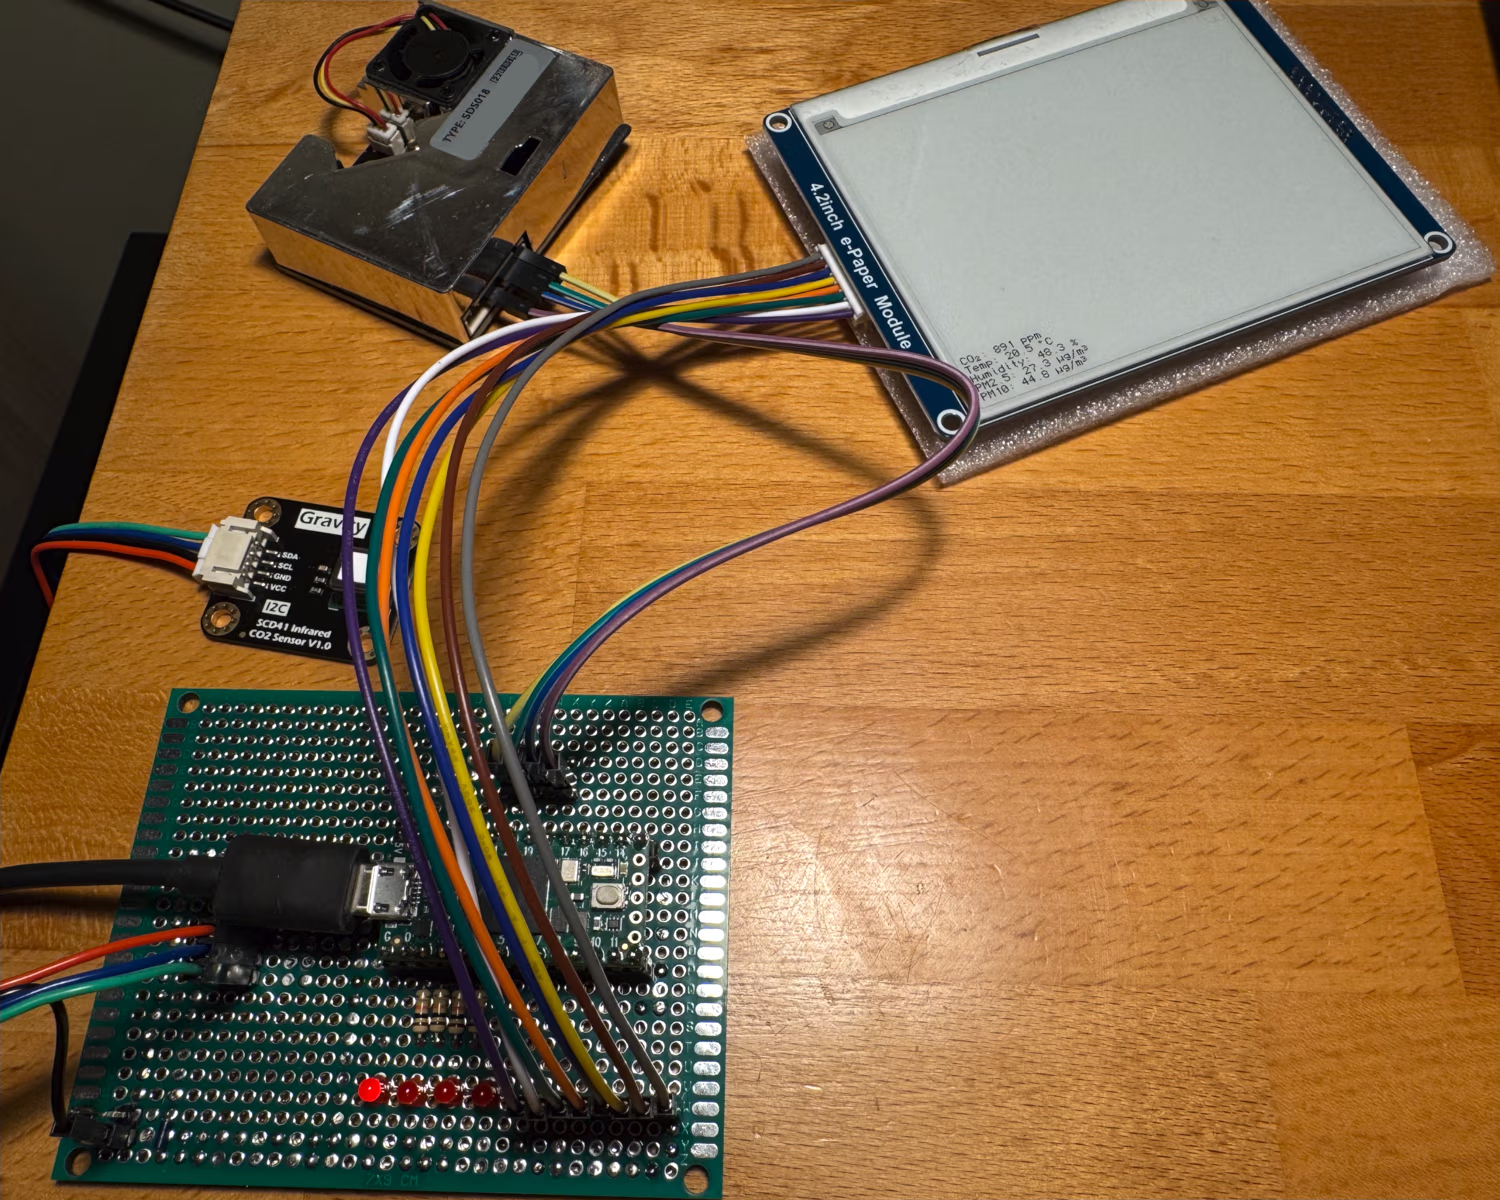
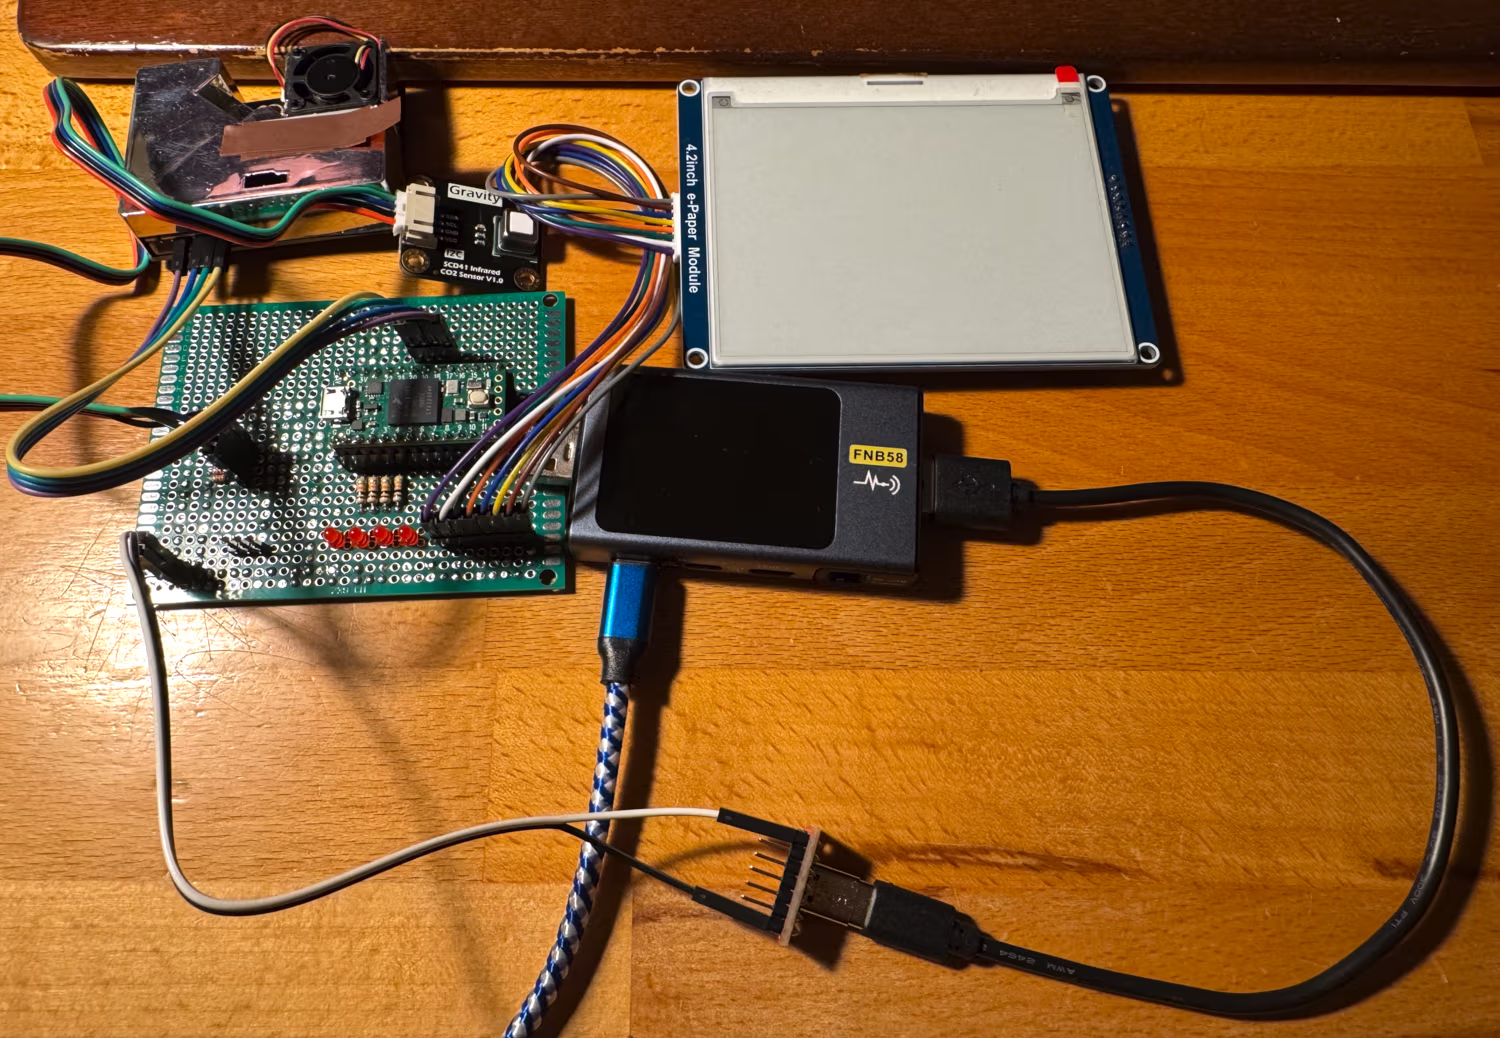
Initial testing setup
The Teensy documentation says that you need pull-up resistors for the I²C data lines:
1K to 4.7K resistors are recommended for most applications. The on-chip pullup resistors in Teensy 2.0, Teensy 4.0, Teensy 4.1 are very weak. Usually communication with 1 chip at 100kHz can work, but with poor signal quality. The on-chip resistors are not enough for several chips or higher speeds.
You can see that I added these on the breadboard and later on the final schematic. These are not really needed as the module already has them. I have not realized that during design.
The sensor can be powered with voltages from 2.4V to 5.5V. Since the voltage levels on the data lines are pulled up to the Vdd (power) level and these are connected to the Teensy data pins, the power supply must not be higher than 3.3V. There is a 3.3V power output pin on the Teensy that we can use.
The sensor communicates with the microcontroller via the I²C serial bus. The datasheet specifies a list of commands and how to parse the responses sent by the device. Here’s a test program I used to test basic functionality:
#include <Wire.h>

struct Measurement {
  uint16_t co2, temp, hum;
};

void SendData(uint16_t data) {
  Wire.beginTransmission(0x62);
  Wire.write(data >> 8);
  Wire.write(data & 0xFF);
  Wire.endTransmission();
}

uint16_t ReadU16() {
  uint16_t resp = Wire.read();
  resp = (resp << 8) | Wire.read();
  return resp;
}

bool DataAvailable() {
  SendData(0xe4b8);
  delay(1);
  Wire.requestFrom(0x62, 2);
  auto res = ReadU16();
  return (res & 0x7ff) != 0;
}

Measurement Measure() {
  SendData(0xec05);
  delay(1);
  Wire.requestFrom(0x62, 9);
  auto co2 = ReadU16();
  Wire.read();
  auto temp = ReadU16();
  Wire.read();
  auto hum = ReadU16();
  Wire.read();
  return { co2, temp, hum };
}

void setup() {
  Serial.begin(9600);
  delay(1000);
  Wire.begin();
  SendData(0x21b1);
}

void loop() {
  if(DataAvailable()) {
    auto m = Measure();
    Serial.print(...);
  }
  delay(100);
}
This program performs automatic periodic measurements (command 0x21b1), while my final firmware uses one-shot measurements (command 0x219d) to reduce power consumption and increase sensor longevity.
Particulate Matter sensor Link to heading
To get the PM2.5 and PM10 levels I purchased a Nova Fitness SDS018 sensor. This is what you get from the manufacturer, not a repack like the DFRobot module above.
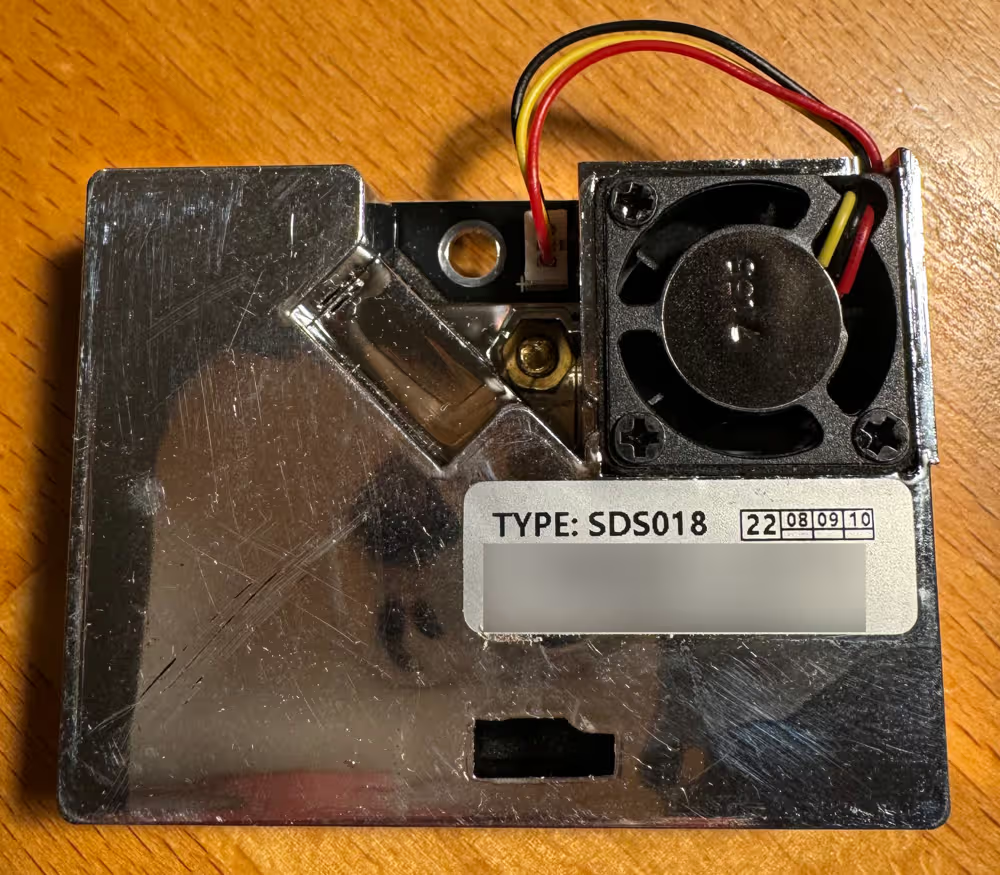
SDS018 sensor
For some reason they also give you a USB stick that acts as a serial port. That’s one way to communicate with this device, I suppose, but it’s completely unnecessary.
The sensor definitely has a mystery Chinese gizmo feel to it, as searching for it on the web will only direct you to a bunch of stores, and there’s no sight of the manufacturer. Oh well, there is a datasheet provided by the store where I bought it,8 so it can’t be that bad.
The SDS018 using principle of laser scattering ,can get the particle concentration between 0.3 to 10μm in the air. It with digital output and built-in fan is stable and reliable.
There’s also the http://www.inovafitness.com/ link in the PDF, but it redirects to another site that’s all in Chinese and appears to be manufacturing some industrial-grade equipment. Yeah…
This device requires a 5V power supply to operate its internal fan and laser, but the data lines are running on a 3.3V level. Remember to always check the datasheet to make sure your components will work together.
Communication is done using the standard serial port (UART) interface.9 When powered on the device runs in “the default configuration that measures at the frequency of 1time per second”. The manual describes the structure of the data packets and how to decode the readings. Here’s a test program I used to make sure everything was working properly:
void setup() {
  Serial.begin(38400);
  Serial1.begin(9600);
}

void GetData( uint8_t data[10] ) {
  for( int i=0; i<10; i++ ) {
    while(!Serial1.available()) delay(1);
    data[i] = Serial1.read();
  }
}

void loop() {
  uint8_t data[10];
  GetData( data );

  float pm25 = ( data[3] * 256 + data[2] ) / 10.f;
  float pm10 = ( data[5] * 256 + data[4] ) / 10.f;

  Serial.print(...);
}
There’s a little problem with that, though. As the spec sheet says,
Service life is the key parameter of laser dust sensor. The laser diode in this sensor has high quality and its service life is up to 8000 hours.
8000 hours of continuous operation is 333 days. That’s less than a year. The datasheet gives advice on what you can do to extend the lifespan of the sensor:
On the occasion of real-time demand is not high (such as filter, air quality monitoring, etc.), you can use the discontinuous working method to prolong the service life. For example, you can start the sensor for 30 seconds per minutes.
Ok, so you need to somehow power it off and on again. Sigh, I wish there was some way to do this via the serial port I am already talking over. Unfortunately, according to the datasheet, there is no way to communicate with the sensor, it just sends the data messages over and over again.
And how do you make an electronic switch that can turn the sensor on and off? That’s easy, with a transistor. Take a look at the schematic below. When the Control signal at the Base terminal is 0V (digital “0” output on the microcontroller pin), the Q1 transistor acts as if there is no connection between the Collector and Emitter terminals. The R3 resistor pulls down the Power output to the ground level. The digital “1” level of 3.3V at the Control input is more than enough to activate the transistor (you would typically need about 0.7V for this), making it act as if the C and E terminals are shorted. The 5V power supply can now flow to the Power output, enabling the sensor.10
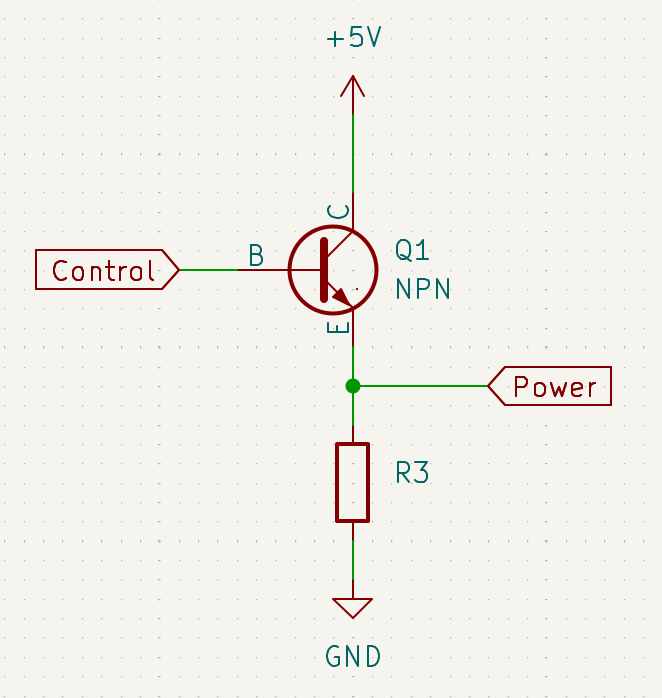
How a transistor works
I literally had a transistor on my desk ready to be put into a prototype circuit, but one line in the “Technical parameters” section just wouldn’t let me rest.
Sleep current (Lase&Fan sleep)
How are the laser and fan supposed to sleep if there is no way to put the device to sleep other than shutting it off?
Let’s search the web again. Oh, there is a github repo with some Python code for interacting with this sensor. But it only reads the data packets, just like I’m already doing. Okay, maybe I should narrow the search to github.com, maybe there’s more code somewhere. And there are several different implementations that all do the same basic stuff, one for Arduino, one for Raspberry Pi, and so on. But then! There’s this snippet of code:
bool NovaFitness::sleep()
{
    std::vector<uint8_t> command = {0xAA, 0xB4, SettingsType::WORK_MODE, SettingsAction::Set, WorkMode::SLEEP, 0x00, 0x00,
                                    0x00, 0x00, 0x00, 0x00, 0x00, 0x00, 0x00,
                                    0x00, 0xFF, 0xFF, 0x05, 0xAB};
    return this->send(command);
}
Wait, what?
There are commands you can send?
As it turns out, yes, there are. The Laser Dust Sensor Control Protocol document provides commands to put the device to sleep and to wake it up, or to change the mode of operation to on-demand single-shot or continuous reading. It’s all for the SDS011 model, and I have the SDS018. I tried it anyway, and it works!
I retrace my steps to find out where I went wrong, why did I not know about this protocol specification? The shop where I bought the device? No, there’s only the datasheet. The manufacturer’s website? Oh, there’s an English version hidden in the corner. But it doesn’t have my device. There’s only the SDS011, and the only way to know that it’s compatible with the SDS018 is to look at random github repositories that make it clear that the same code can handle both sensors.
A mystery device for sure.
Eink display Link to heading
For the e-paper display I went with a Waveshare 400×300 px 4.2 inch module. This is a combination of a raw display panel and the driver board. You may be able to purchase these separately, but you must have both to work with the display. At 119 PPI, the display is definitely not hi-dpi, but it’s perfectly usable.
Eink display module
This display can show 4 different grayscale colors and uses a planar memory layout. There are two 15KB memory banks ($400*300/8=15000$), one for the “black” color and the other for the “red” color. This naming comes from another type of eink display where you can have three different colors (white, black, and red). The epaper model I purchased can only display the white or black color, and the red bitplane has been repurposed to serve as an extra channel used to select the specific way the eink microcapsules are arranged by the driver board to produce gray levels.
As I’m sure you know, the eink display does not need to be powered to maintain what it displays. In fact, it’s more than that, because it can’t be powered on all the time, or the screen will be damaged, as the vendor warns. The way to operate the epaper screen each time you want to update its contents is:
- Perform a hardware reset,
- Perform a software reset,
- Set the hardware to the appropriate work mode, set the memory pointers, and specify how to increment them,
- Upload the image data,
- Perform a screen refresh,
- Enter deep sleep mode (the only way to wake it up is to perform a hardware reset).
The exact way to do this is described in the User Manual provided by the manufacturer. You also get the datasheet for the raw display and the controller unit on the driver board, but you won’t access these components directly. You communicate with the board via the serial SPI interface.11
But there’s a little problem. The SPI interface uses 4 data lines:
- SCLK (clock),
- MOSI (data write),
- MISO (data read),
- SS (slave select).
Add two more wires for power and ground… and there still are two pins left on the board. What are they for?
The labels for them are “reset” and “busy”. Yes, this fun device is controlled by a serial protocol, but it also has extra data lines that are used as side channels. For example, after issuing a screen refresh command over the serial connection, you need to wait for the “busy” data line to go low before issuing any other commands to the panel.
If you follow the instructions in the manual, you will get a very unpleasant flickering on every screen refresh, about 20 back and forth inversions of the screen contents. For anything more, you’ll have to consult the github repository with more advanced usage examples, as the manual doesn’t explain anything more.
#include <SPI.h>
#include <vector>
constexpr int Busy = 7;
constexpr int Reset = 8;
constexpr int DataCommand = 9;
constexpr int SlaveSelect = 10;
constexpr int Data = HIGH;
constexpr int Command = LOW;
void EinkCommand(uint8_t command, std::vector<uint8_t> data = {}) {
digitalWrite(DataCommand, Command);
SPI.transfer(command);
if(!data.empty()) {
digitalWrite(DataCommand, Data);
for(auto& byte : data) SPI.transfer(byte);
}
}
void mario(uint16_t a) {
for( int i=0; i<20; i++ ) SPI.transfer(0xFF);
SPI.transfer(a >> 8);
SPI.transfer(a & 0xFF);
for( int i=0; i<28; i++ ) SPI.transfer(0xFF);
}
void setup() {
Serial.begin(38400);
pinMode(Reset, OUTPUT);
pinMode(DataCommand, OUTPUT);
pinMode(SlaveSelect, OUTPUT);
SPI.begin();
delay(10);
// hardware reset
digitalWrite(Reset, LOW);
delayMicroseconds(200);
digitalWrite(Reset, HIGH);
delayMicroseconds(200);
while(digitalRead(Busy) != 0) {};
// software reset
digitalWrite(SlaveSelect, LOW);
EinkCommand(0x12);
while(digitalRead(Busy) != 0) {};
EinkCommand(0x01, {0x2b, 0x01, 0x00}); // display size
EinkCommand(0x11, {0x01}); // ram data entry mode
EinkCommand(0x44, {0x00, 0x31}); // ram x address
EinkCommand(0x45, {0x2b, 0x01, 0x00, 0x00}); // ram y address
EinkCommand(0x3c, {0x01}); // border
EinkCommand(0x4e, {0x00}); // ram x counter
EinkCommand(0x4f, {0x2b, 0x00}); // ram y counter
EinkCommand(0x24); // b/w image
digitalWrite(DataCommand, Data);
for( int i=0; i<50*20; i++) SPI.transfer(0xFF);
mario(0b1111100000111111);
mario(0b1111000000000111);
mario(0b1111000001011111);
mario(0b1110000001000111);
mario(0b1110000000000011);
mario(0b1111000000000111);
mario(0b1111100000011111);
mario(0b1111000000001111);
mario(0b1110000000000111);
mario(0b1100000000000011);
mario(0b1100001001000011);
mario(0b1100000000000011);
mario(0b1100000000000011);
mario(0b1111000110001111);
mario(0b1110001111000111);
mario(0b1100011111100011);
for( int i=0; i<28; i++ ) SPI.transfer(0xFF);
for( int i=0; i<50*264; i++) SPI.transfer(0xFF);
EinkCommand(0x26); // red image
digitalWrite(DataCommand, Data);
for( int i=0; i<15000; i++) SPI.transfer(0x00);
EinkCommand(0x20); // master activation
while(digitalRead(Busy) != 0) {};
EinkCommand(0x10, {0x01}); // deep sleep
}
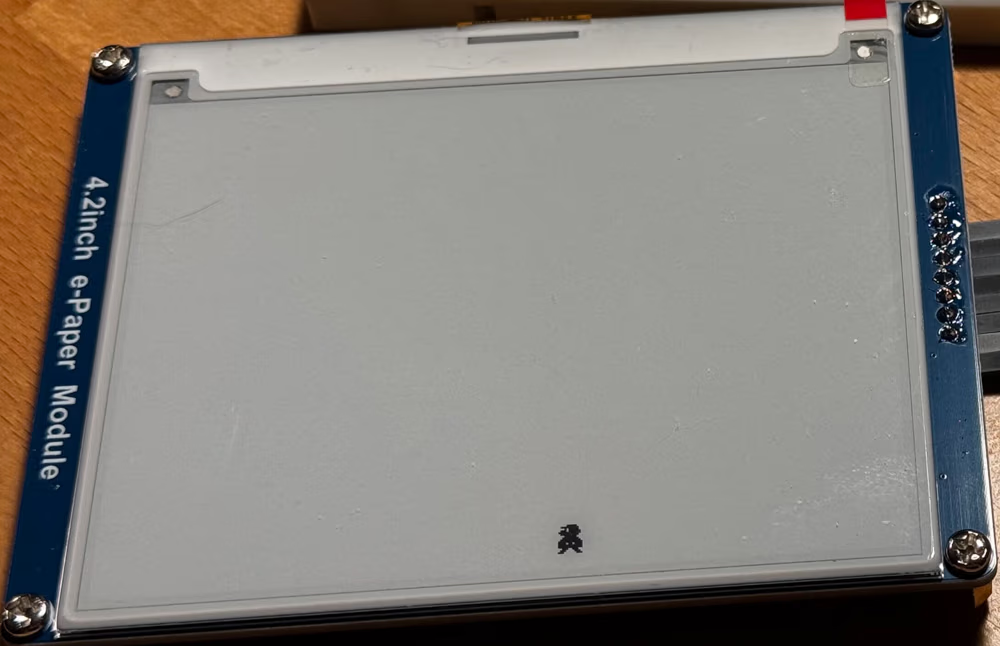
void loop() {}

Result of running the above program
To get 4 shades of gray, you need to upload some undocumented binary data as a LUT for the driver board, so it knows how to properly display the data in bitplanes. The screen refresh is still a flicker, but slower and longer. I wasn’t happy with that and figured I don’t really need the grayscales to just show some graphs.
There’s also a “fast” refresh mode, which for some reason requires configuring the temperature sensor and then adjusting some other commands sent to the board. In this mode, there is only one screen refresh inversion, and it’s reasonably quick. To get it working, you blindly follow whatever is on the github repo, because none of it makes much sense when you match it against the list of available commands.
Finally, there’s the “partial” refresh mode, which is supposed to update the screen contents without any inversion at all, and be much faster than the other modes. I have not been able to get it to work properly,12 and the sample code mixes two meanings of a partial refresh, the second one being to update only a small part of the display memory banks.
Looking at the third-party libraries for handling this display, I could see that other people have encountered the same problems. Apparently there was a v2.1 version of the screen for which the partial refresh LUT was provided by the vendor and it worked very well. However, for the v2.2 version I have, there is no LUT and much of the driver board interface has changed in an incompatible way.
The manufacturer clearly tries to be very helpful with all the resources they provide on their wiki, but they completely miss what’s really important in such documentation. Here’s a short excerpt from their FAQ to illustrate:
Question: What is the process of refreshing e-Paper partially?
Answer: There are mainly two types of e-Paper screens.
- One is to refresh the background image first.
- The other is to alternately refresh old data and new data.
…yeah.
Putting it all together Link to heading
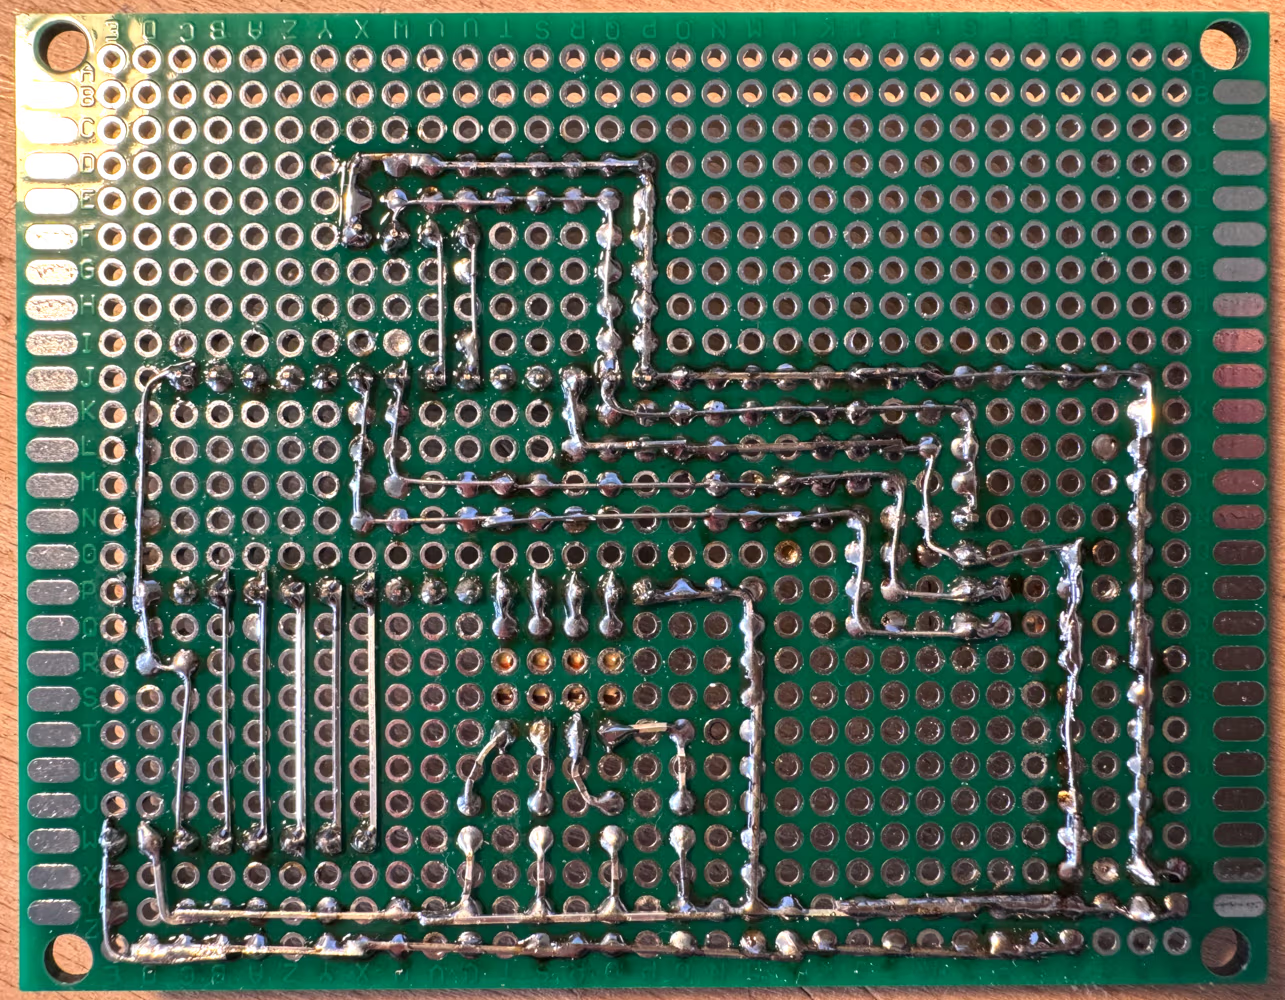
With all the components tested, I had to figure out how to connect everything in a more permanent way than a breadboard. I came up with the following schematic. There was only one bridge needed to solve the wire crossing.

Everything laid out
I don’t know how to use all those fancy CAD programs, so I just use Inkscape instead. The yellow dots are pins, and the black lines are connections, of course. The four red circles are status LEDs, I don’t need to draw how they are connected to solder them correctly.
There are four pin clusters:
- Bottom left: power to the board.
- Middle left: CO₂ sensor, with the pull-up resistors on the data lines.
- Bottom right: Eink display.
- Above the microcontroller: PM sensor.
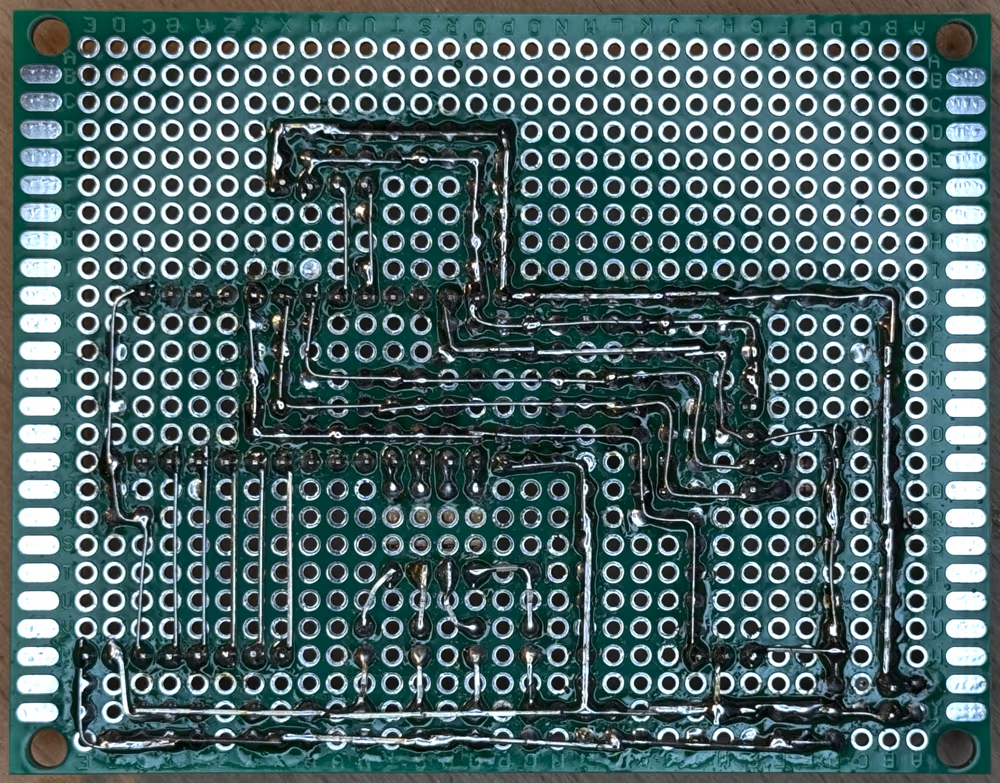
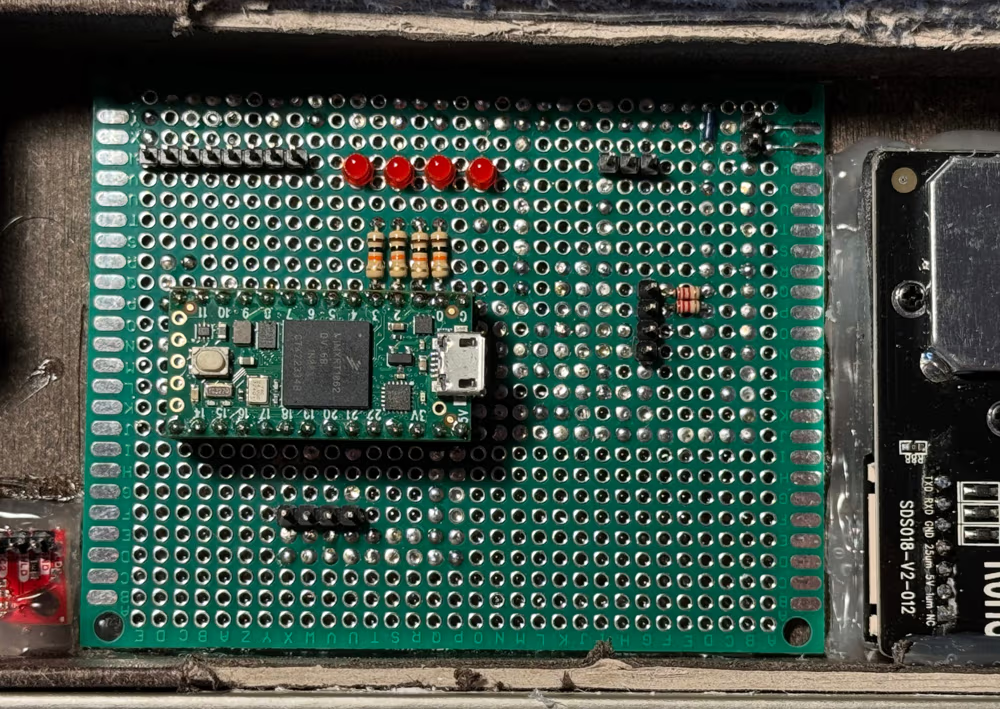
And here’s the finished board:
Always prefer to use sockets The final layout follows the schematic with a few minor differences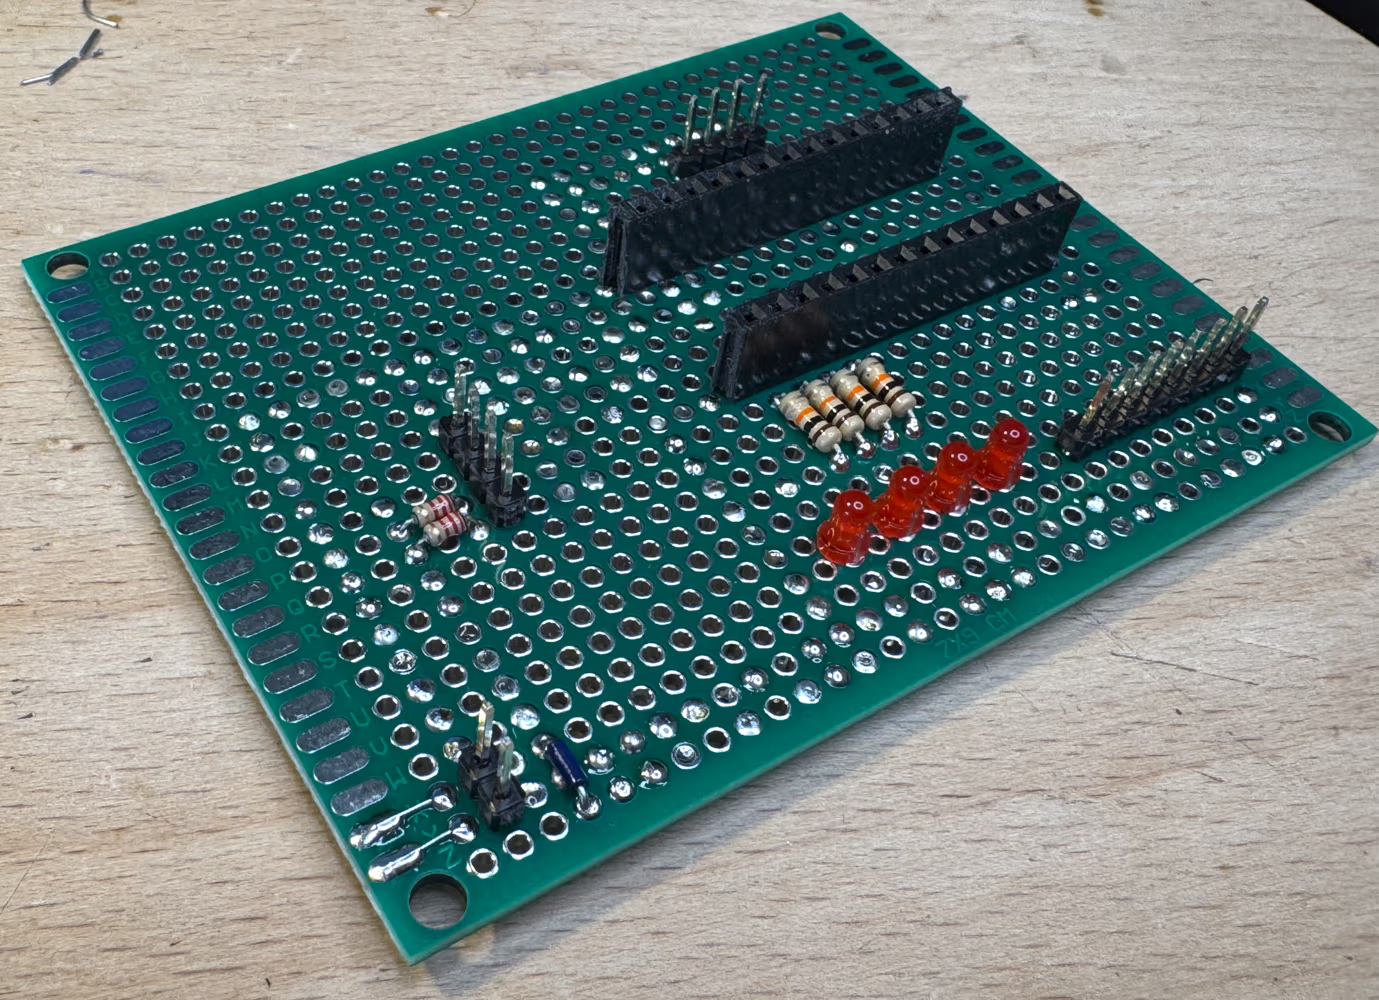
The microcontroller can now be socketed and all the peripherals can be connected. At that moment, you’re always wondering if you’ve made any mistakes and if everything’s going to work out.
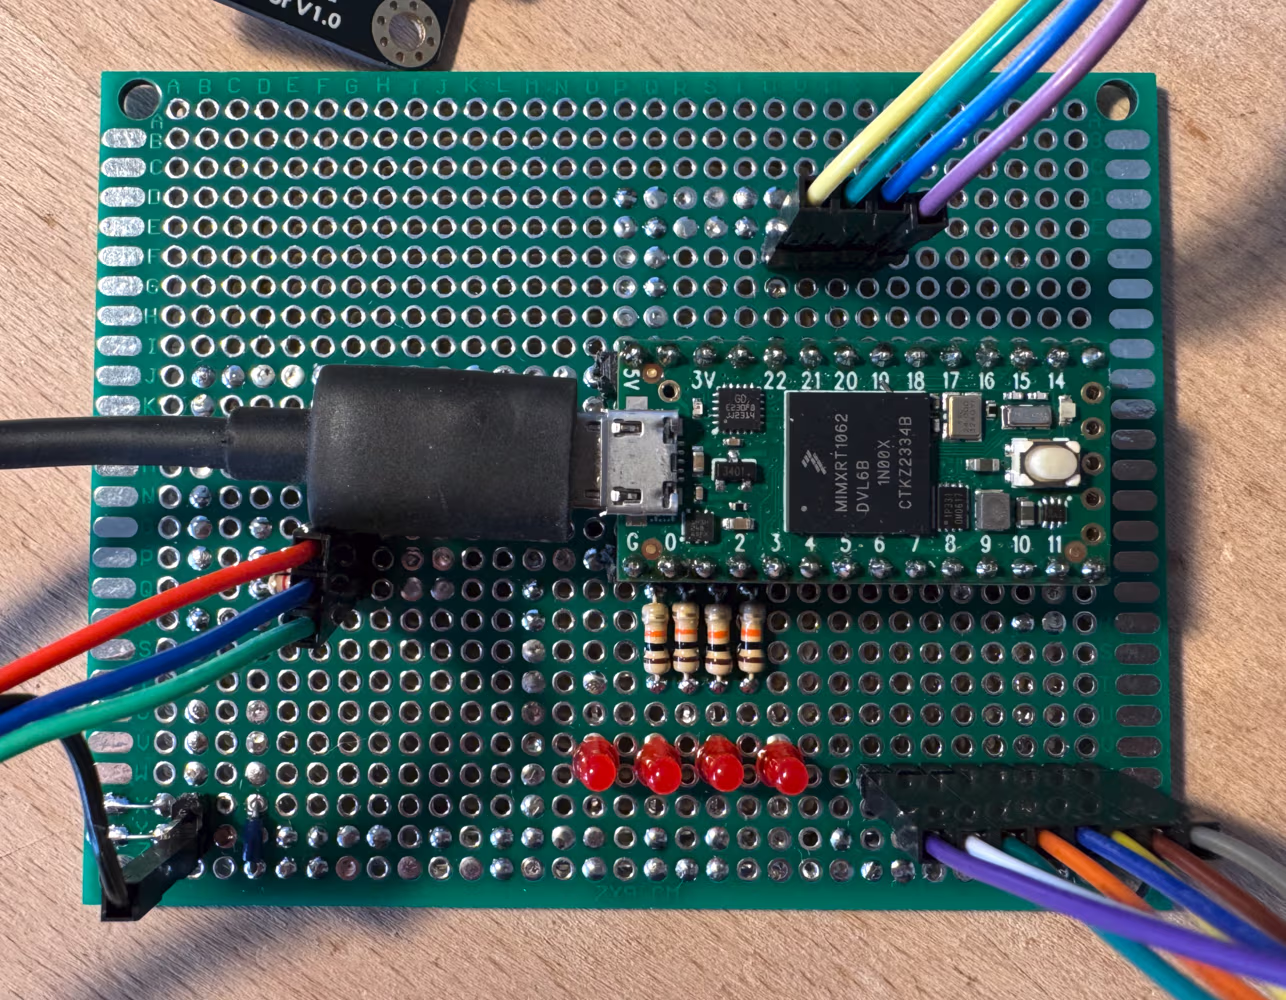
The good news is that on the electrical side everything is fine. The bad news is that I largely ignored the clearance required for the USB plug. Now when I want to work on the firmware, which requires the USB connector, I can’t get the CO₂ sensor ground connection to the right pin. Fortunately, I can just plug it to the ground pin of the power delivery cluster.
Which is actually a surprise safety feature!
The problem is that the board can be powered in two different ways. The first is through the USB port on the microcontroller. The second is using the dedicated power pins. You can go either way, but if you had both connected at the same time, there’s definitely potential for very exciting things to happen. You can cut a trace on the microcontroller to prevent this, but then you’d always have to have both the external power supply and a USB connected to be able to program the microcontroller. But with the little clearance accident I had, it is not possible to have everything connected at the same time.
Printing results Link to heading
With everything in place, I could easily merge my test programs to produce the measurements. The basic loop that the microcontroller will do ad infinitum is:
- Make a CO₂ measurement (also gives temperature and humidity). This takes a few seconds.
- Start the PM sensor fan, wait 30 seconds for the data to stabilize, take the reading, then turn the fan off.
- Refresh the display.
- Wait until one minute has elapsed from the start of the loop.
This will effectively give you one reading per minute for each of the values. You can also notice that the number of steps I have outlined for some reason matches the number of LEDs I have placed on the board.
The problem I had remaining was how to display things on the eink display. I obviously needed some way to print text, and I remembered that there was a very nice pixel font called “Xen” from the Amiga days.
The font is 6x8 px (5x8 if you notice that all but a few characters have the last column blank), which is not convenient to encode in the width-first way you’d typically use to copy image data to the screen. But you can encode height-first which fits columns nicely into the 8 bits available in a byte. With 1 byte per column, this results in something like
constexpr uint8_t Font[] = {
0x00, 0x00, 0x00, 0x00, 0x00,
0x00, 0x00, 0x5f, 0x00, 0x00,
0x00, 0x03, 0x00, 0x03, 0x00,
0x14, 0x7f, 0x14, 0x7f, 0x14,
0x24, 0x2a, 0x6b, 0x2a, 0x12,
...
To draw pixels on the screen I just went the most basic route possible.
uint8_t Plane0[15000];

void FbSetPlane0(int x, int y, bool enable) {
  int idx = y*50 + x/8;
  int bit = x%8;
  int mask = 1 << bit;

  if(enable) Plane0[idx] |= mask;
  else Plane0[idx] &= ~mask;
}
This was the result, where a bunch of bugs were coupled together. Wrong line addressing (the uppercase “CO” is offset by 1 pixel line instead of going to the second text line, the lowercase “ppm” is offset by 2 pixel lines instead of going to the third text line), going the wrong way horizontally too… And who knows what else was wrong there.
Uhm…
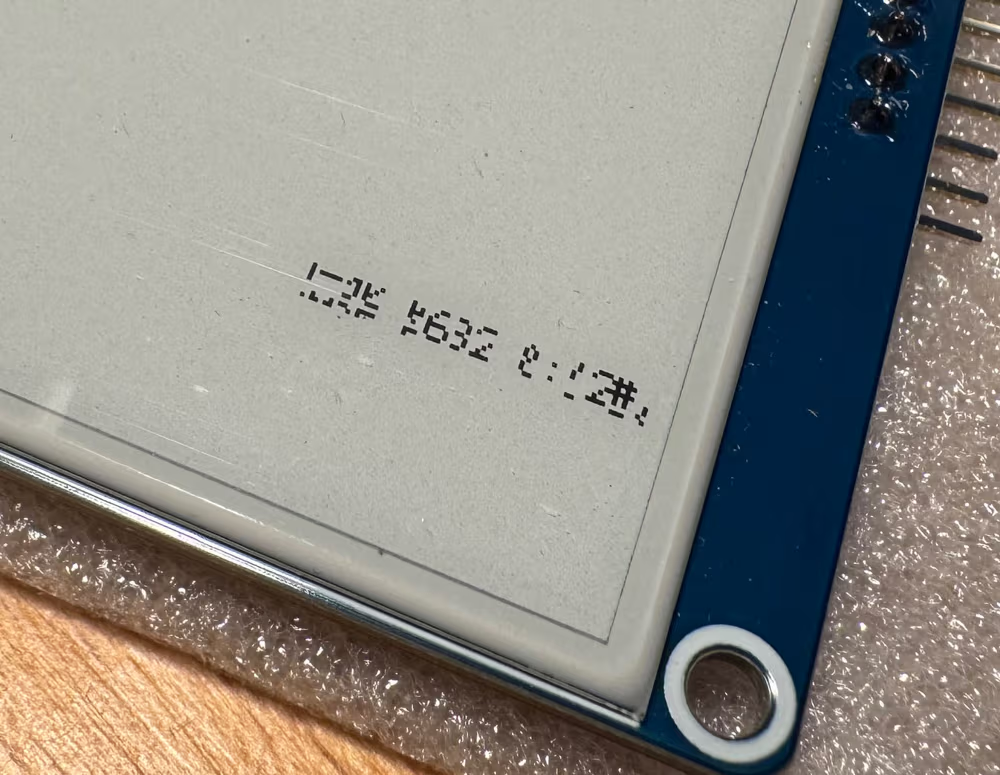
When I fixed the font data processing, the result was still wrong.
At least you can read it now
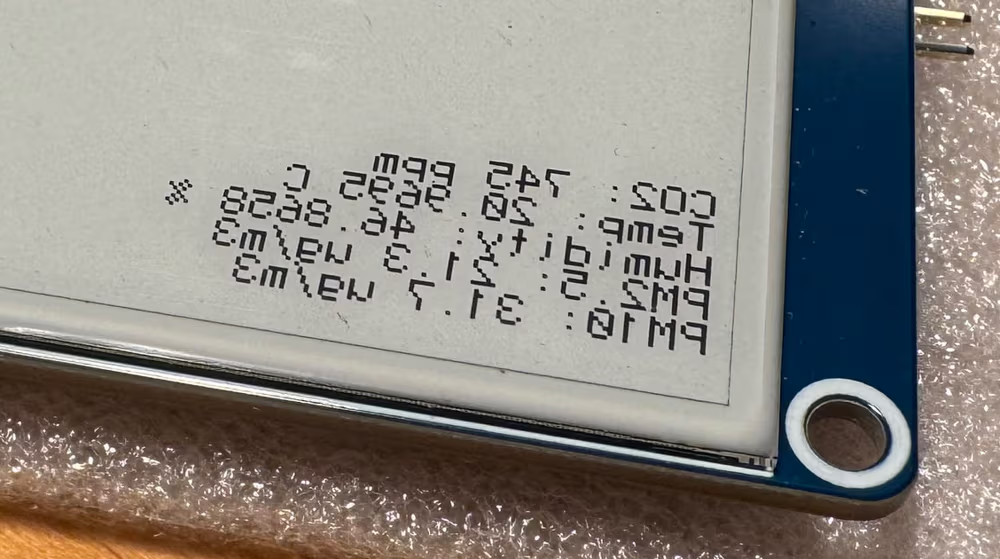
Then, after mirroring the screen (which also required reversing the bits in each byte13), and adding some special characters to the font I was happy with what I had.
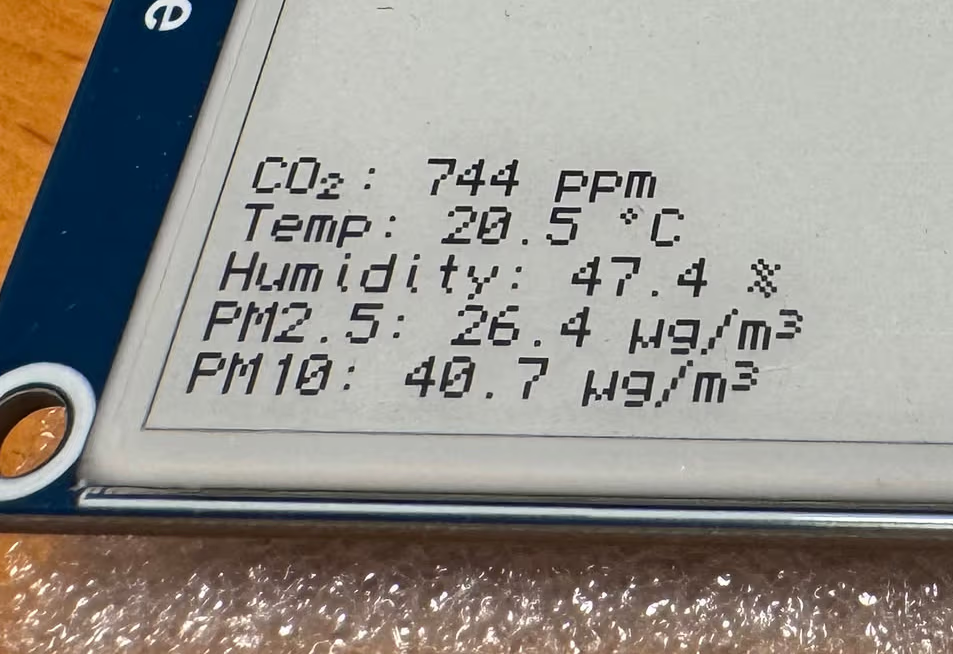
Looks good
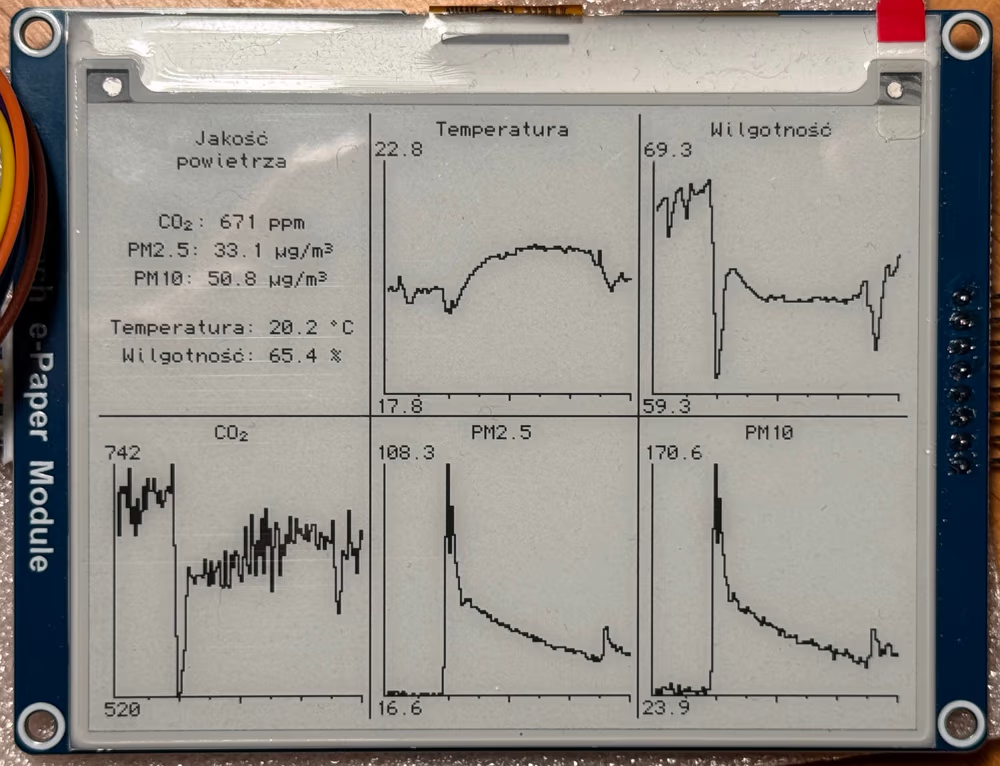
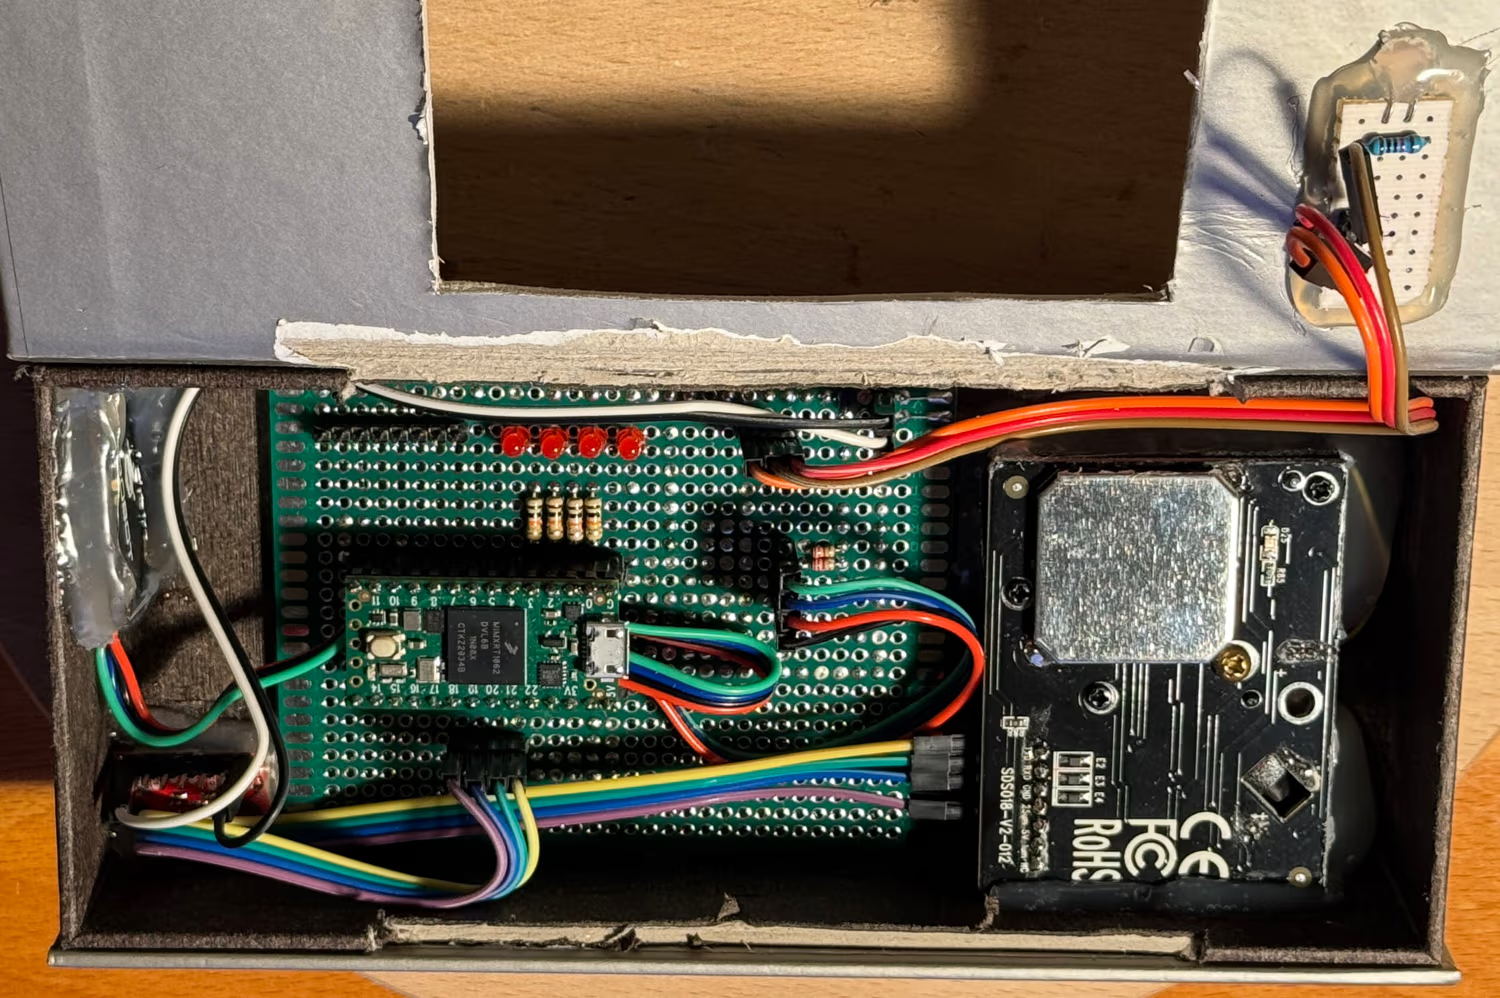
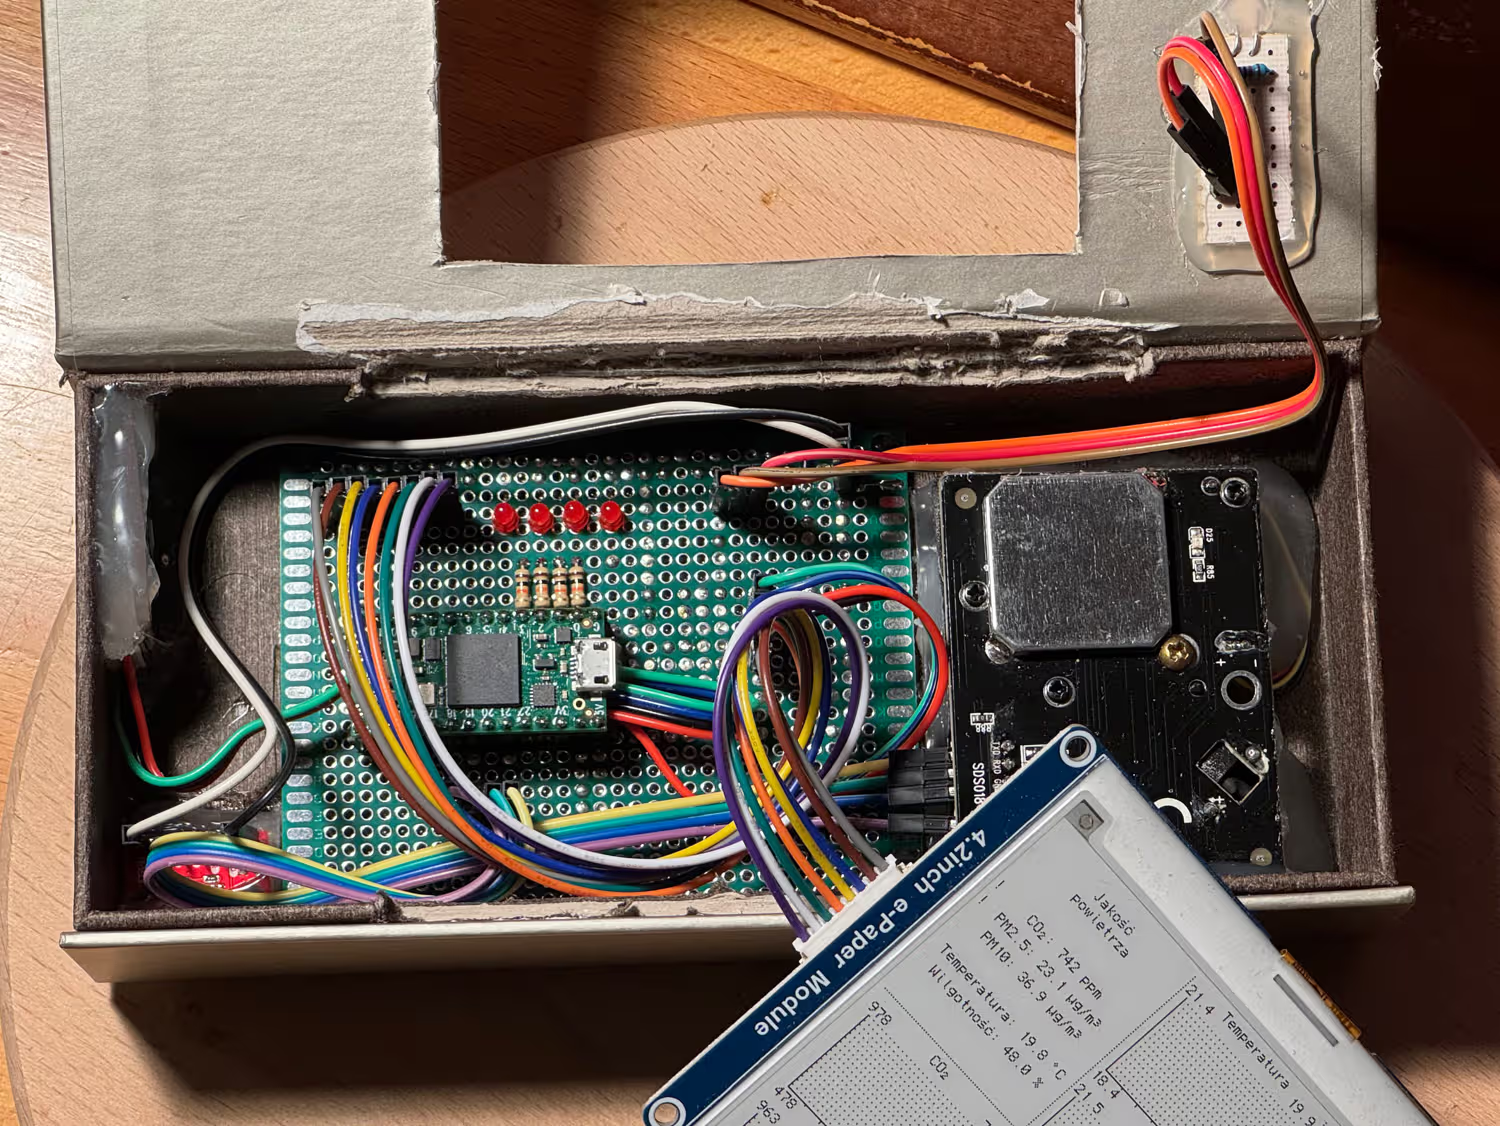
It may seem all fine, but the CO₂ label should be in the top right corner of the display, not at some seemingly random offset. Well, the eink memory pointers definitely need to be rechecked. Either way, here’s how it all looks put together:
Everything connected and working
Making it look nice Link to heading
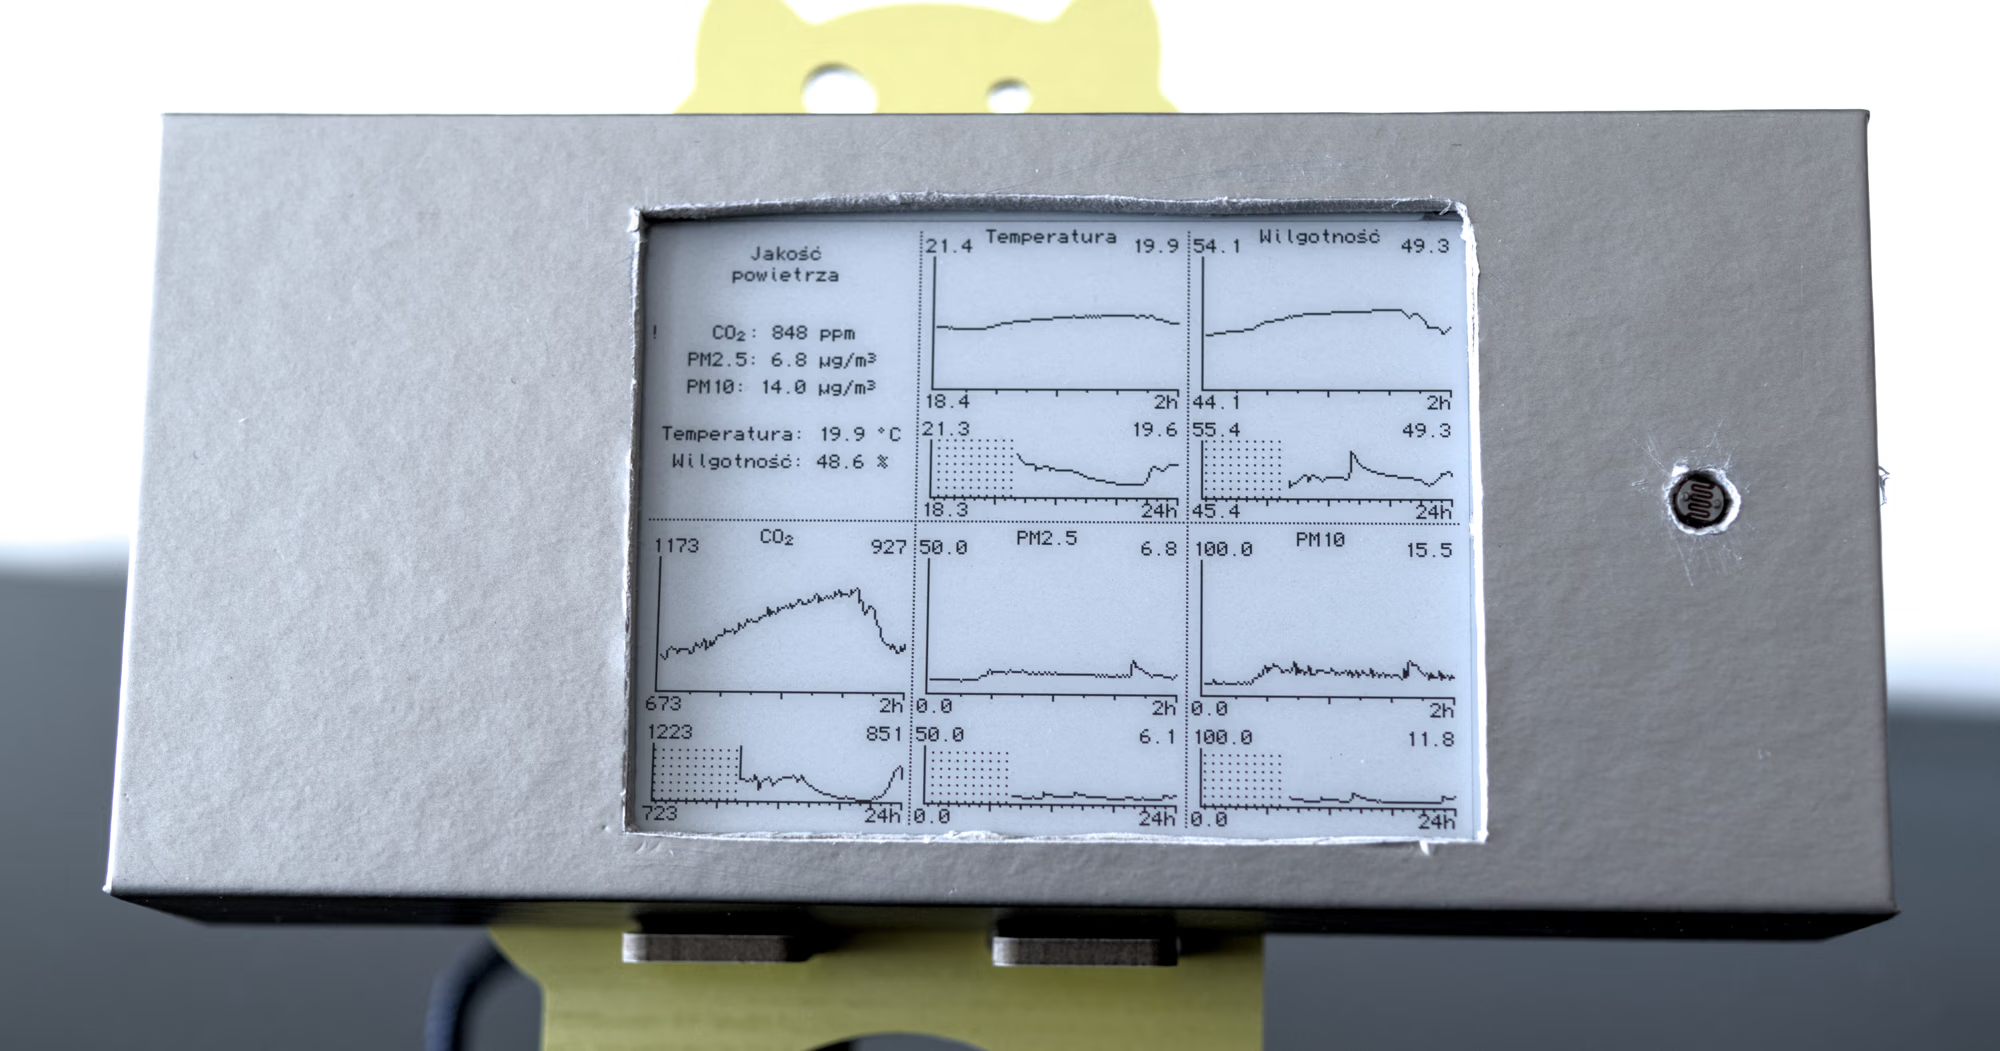
The sensors give me five different readings to display. That’s five graphs, and I should also show the most recent readings somewhere. It’s quite convenient because the 400×300 screen can be neatly divided into six squarish sectors, each 133x150 pixels in size.
I was initially concerned that the latest readings, as shown in the prototype above, were quite compact and would not fit well in the available space. By adding a header and some spacing to the lines of text, along with centering the text, things started to look a lot better.
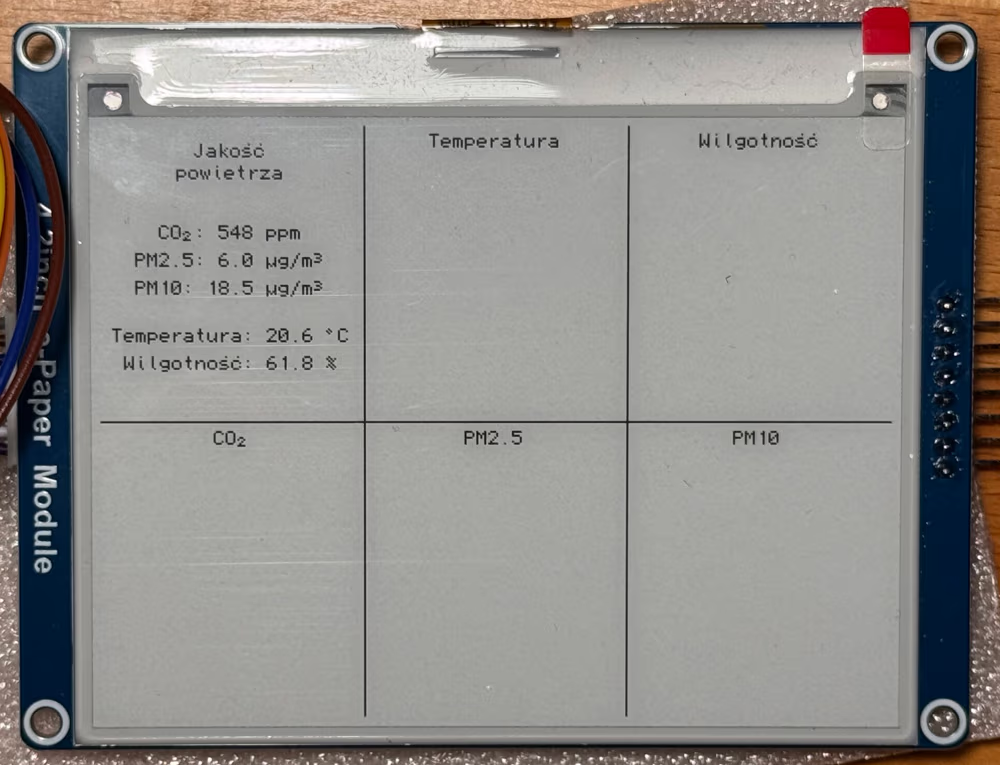
Display layout
The next step was to draw the graph axis lines and print min and max labels for the Y axis. I also wanted to somehow indicate an area of the graph where data was missing. The first thing I tried was the checkerboard pattern. And the results were quite interesting. The epaper panel was not refreshed correctly, with many pixels missing or half-set, not even necessarily in the rows or columns where the pattern was drawn.
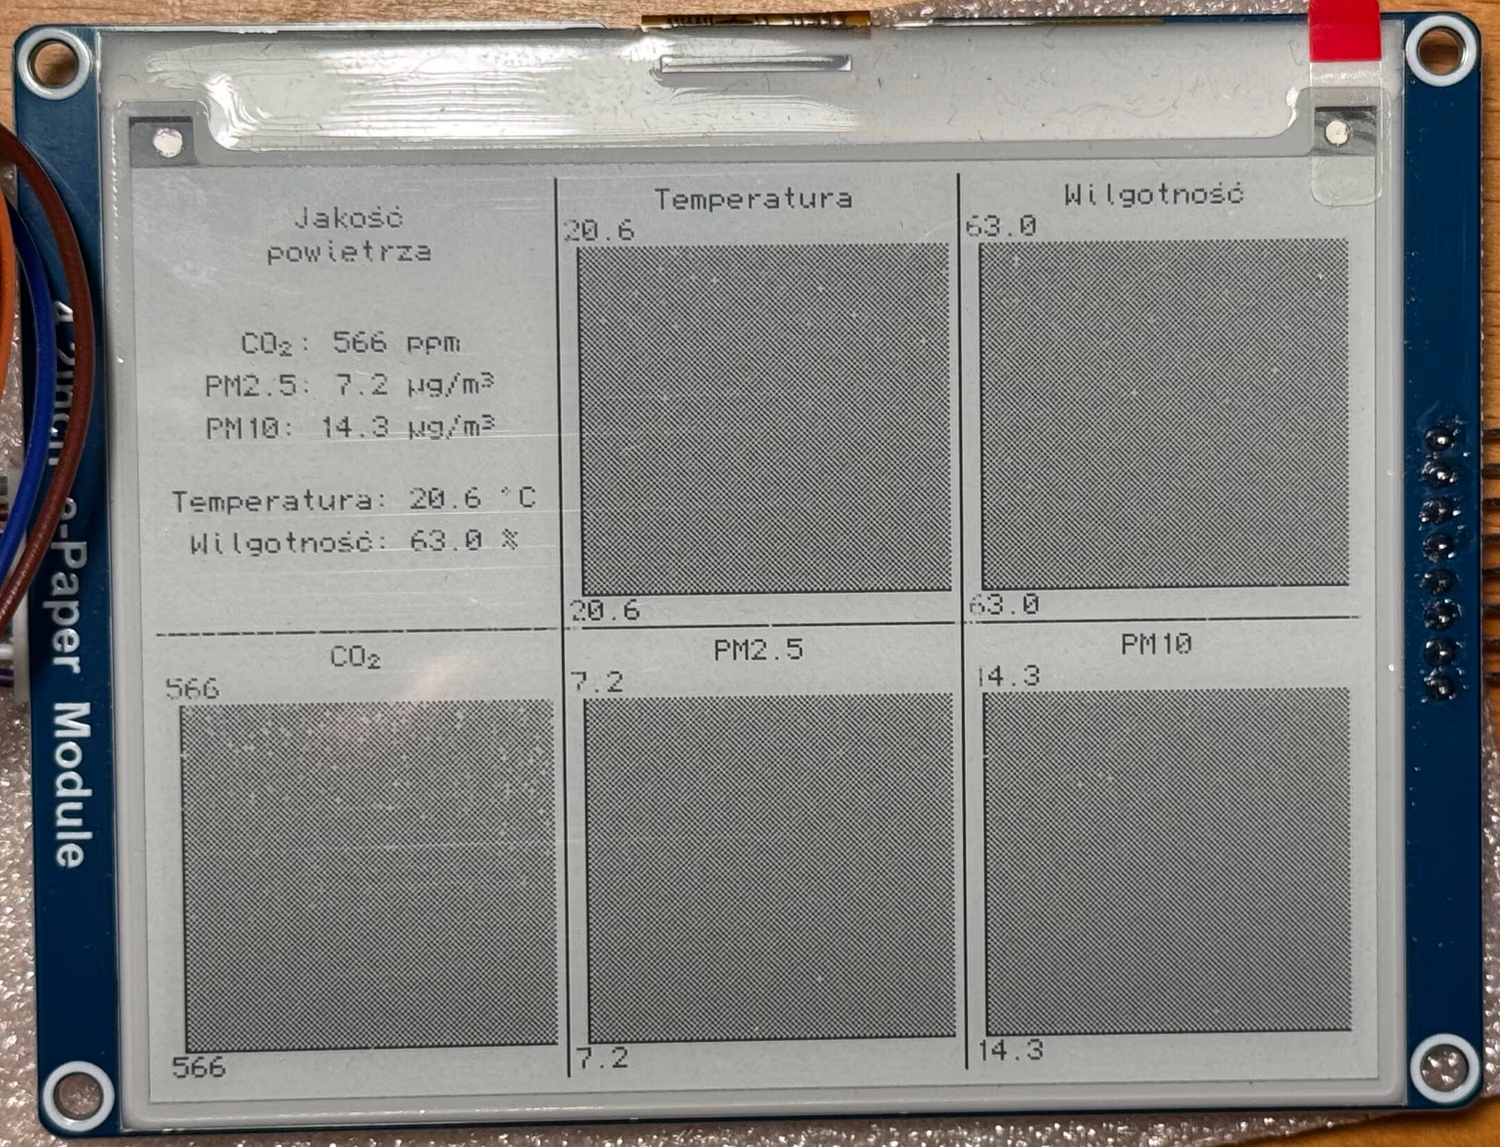
Everything is falling apart
Eventually I settled on a more spaced dot pattern that didn’t have this problem. You can see it in the video below, where I also show all the stages of the main loop. The PM sensor fan cycle was shortened considerably to avoid a half minute pause in the middle of the clip. A momentary flash of the fourth diode between stages 2 and 3 indicates the time needed to draw everything in the video buffer in the microcontroller’s memory.
The next step was to graph the measured data. Here’s the first attempt.
Hey, an actual graph!
If you look closely, you will notice that the graphs are inverted. Oops! The data can also feel a bit erratic, which can be fixed by setting the minimum range to a value that will hide the noise.
I also added some notches to the X axis to show the time. The 133 pixel width of each screen sector is another nice coincidence. After subtracting a margin here and there, you are left with about 120 columns for the graph. And that’s exactly two hours, with each once-a-minute reading having its own column.
Fixes, fixes
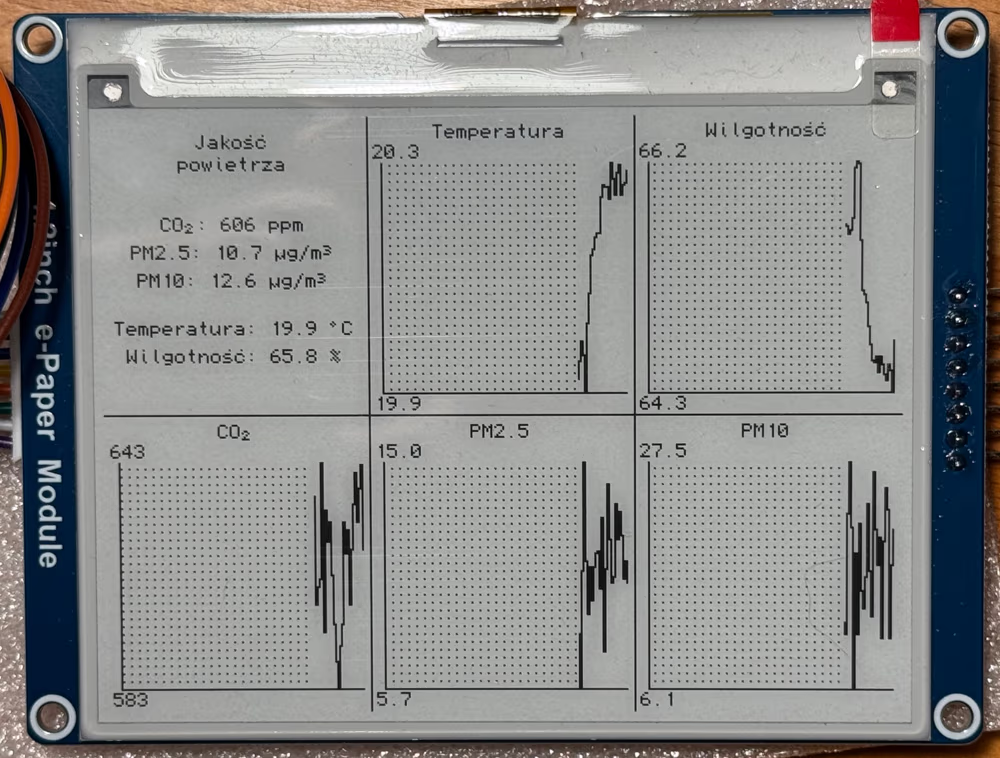
After a test run, I found that the two-hour time window, while good for showing recent history, dropped the data a bit too fast for my taste. I added a second set of graphs scaled to 24 hours. Once again, the segment width proved to be very handy. 120 pixels divided by 24 hours equals 5 graph columns per hour. Implementing this was very simple – accumulate 12 readings, calculate the average, and plot it. Here’s the result:
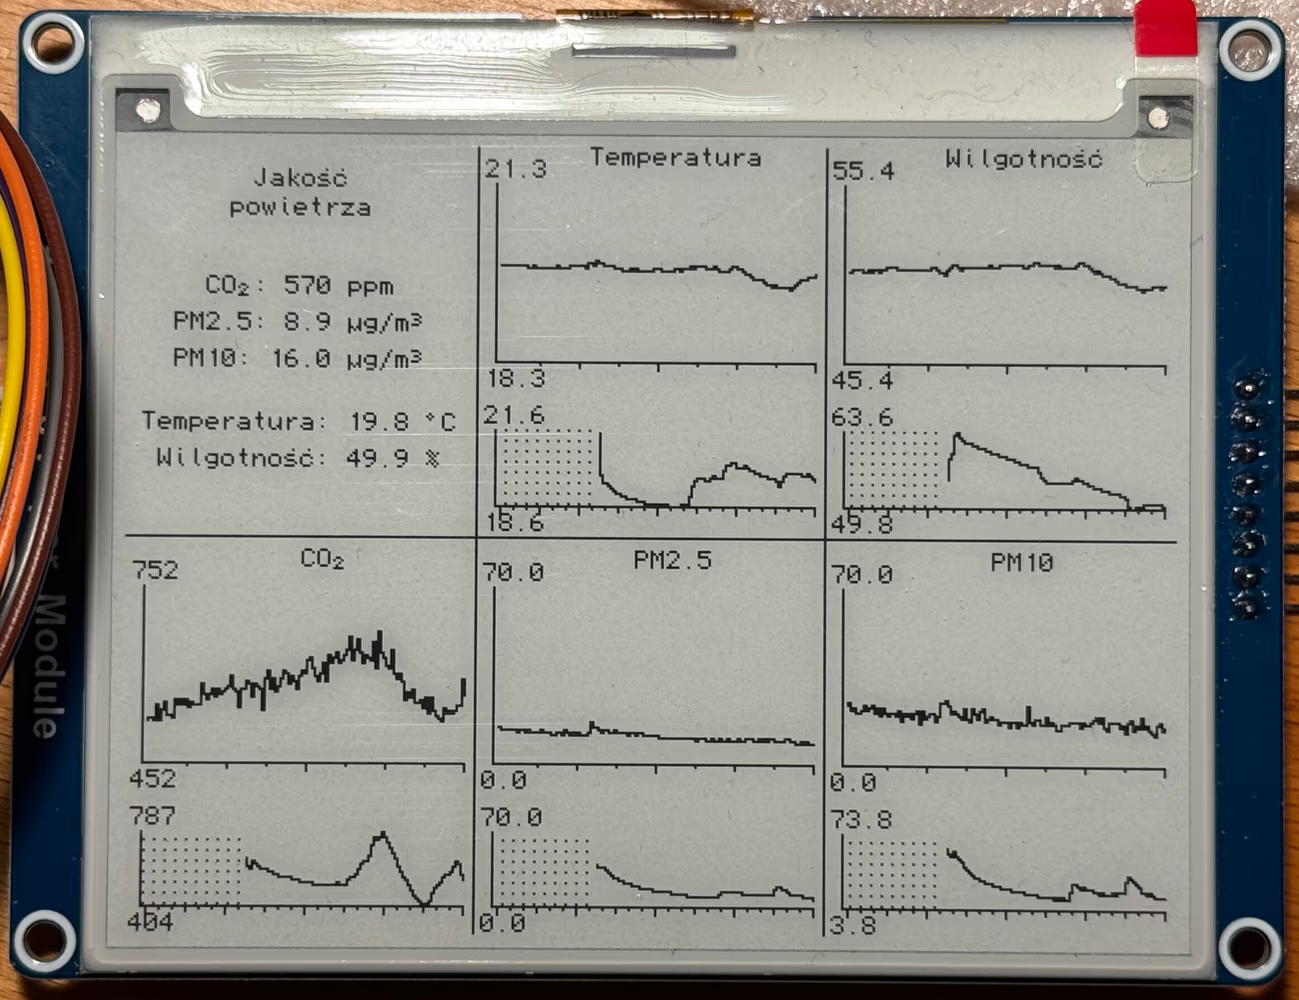
2h and 24h graphs together
There were still some problems that you can see with a good eye. For example, the minimum graph value is drawn on top of the axis. Also, the plots are a bit thick because the graph algorithm draws a staircase. I fixed these issues and, for the first time, used an actual test pattern to see how it would look.
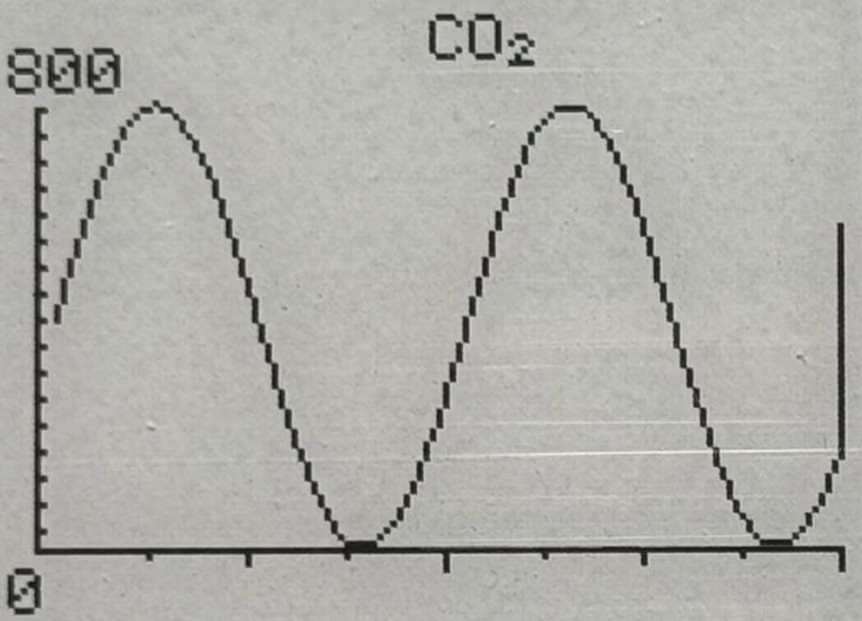
Using a sine wave for a test
To make the CO₂ graph a bit smoother, I have added a second measurement with this sensor after the PM sensor completes its 30+ second run cycle, which spreads the CO₂ readings out over time. The two samples are then averaged to produce the value that goes into the data store.
Screen Safe option use AI to achieve good life Link to heading
The vendor recommendations for using the eink display are interesting. Definitely not something you’d expect from the way you’d use, say, an ebook reader.
When using the e-Paper display, it is recommended that the refresh interval is at least 180s, and refresh at least once every 24 hours. If the e-Paper is not used for a long time, you should use the program to clear the screen before storing it.
I draw new data on the screen every minute, so it’s a little faster than the recommended 3 minutes. And of course I want it to be that way, because I want to see the current values at all times.
But! This is an epaper screen, and you need some external light to be able to read what’s on it. Why would I want to refresh the display in the middle of the night if you just can’t see it? If I could somehow detect when it’s dark, I could just stop updating the eink display, and that should extend its life a bit.
…
As you may remember, I do happen to have a light sensor in my drawer.
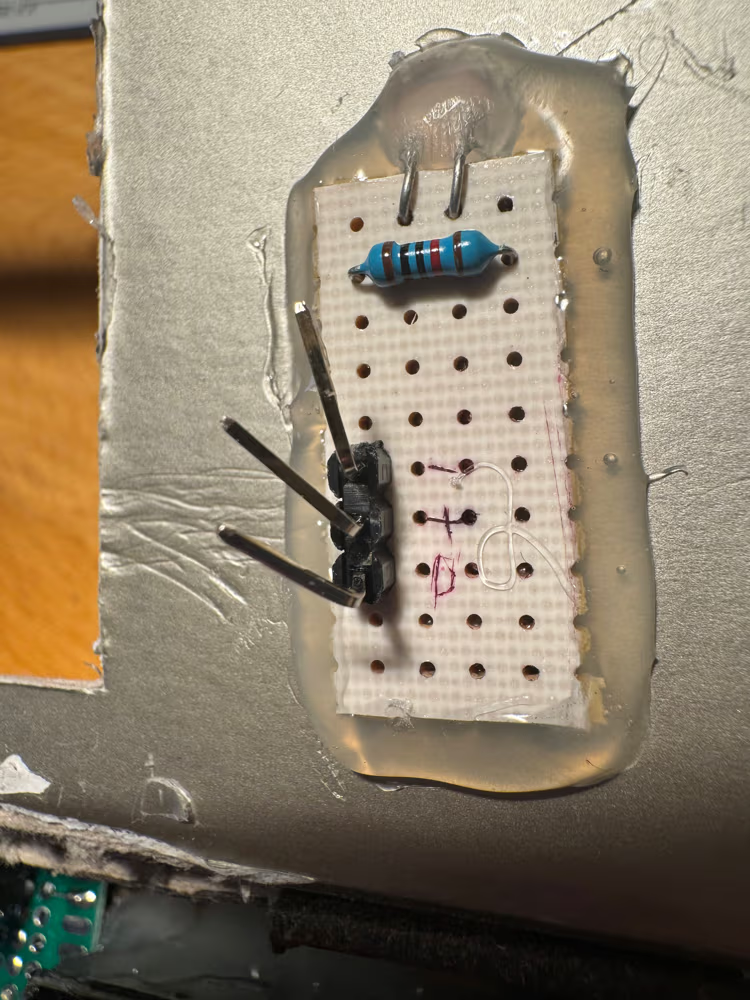
I just need to find a microcontroller pin I could use to read the values reported by the sensor, and figure out how to route it, along with power lines, to a new pin cluster on my board.

Pin 17 can do analog reads, and I can easily route it to an empty space that has 3.3V and ground next to it
Now it’s just a matter of some quick soldering.
Soldering these long wires is really annoying
On the software side, I added a light level check just before drawing the graphs on the screen. If it’s too dark to see the eink display, I set a “screen saver” image, or just do nothing if the image has already been set. The purpose of this image is to keep the screen mostly white, as recommended by the manufacturer, but also to indicate that a “dark mode” has been activated. Note that all of this is done only when the screen is about to be refreshed. I don’t want to actively clear the screen while the data is still “valid” (i.e., showing the most recent sensor readings).

Protip: Draw a star next to the inner edge of the crescent
I don’t want the image to always land on the same pixels, so the position is randomized. Some people on the web will advise you to read an unconnected (“floating”) pin of the microcontroller as the source of the random seed, but in my tests the obtained values do not really change that much over time. Instead, I opted to use the number of microseconds since the microcontroller was turned on, which rolls over in a little over an hour.
The display wakeup procedure is much more aggressive. When the “dark mode” is active, the two main delays I have in my firmware (the 30 second PM sensor wait and the whatever-remains-to-full-minute sleep) constantly check the light value, and if it exceeds the threshold,14 the screen is immediately refreshed to show the most recent readings. When I turn on the light in a dark room, I want to be able to read the screen immediately.
Here’s a demo of how the light sensor works in practice.
Power issues Link to heading
You can get 5V out of a USB cable. I wanted to move with the times and use a USB C connector so I wouldn’t have to figure out which way to plug the damn thing.
I had some USB A to USB C cables lying around, so I took one and cut off the USB A end to get to the wires. I quickly checked to see if I was getting the 5V I should be getting, and… nothing. I tried the same thing with a different cable and the result was the same.
Well, that’s a bummer. I guess I could just use a charger instead, but that would require soldering the wires in permanently and hanging it from my device like a ballast.
Later I found out that to get the 5V out of a USB C cable you have to put a 5.1K pull-down resistor on the CC1 line. The cables I used had no such wire, only power, ground and the usual two data lines. The likely reason was that these cables were only intended to be used with USB A as the power source, and the USB C end was not supposed to provide any power. Oh well.
I found some USB C modules in the store that had both the required resistor and the pinout that I could easily connect to. The price of the whole assembly was not much more than the price of the port on its own.
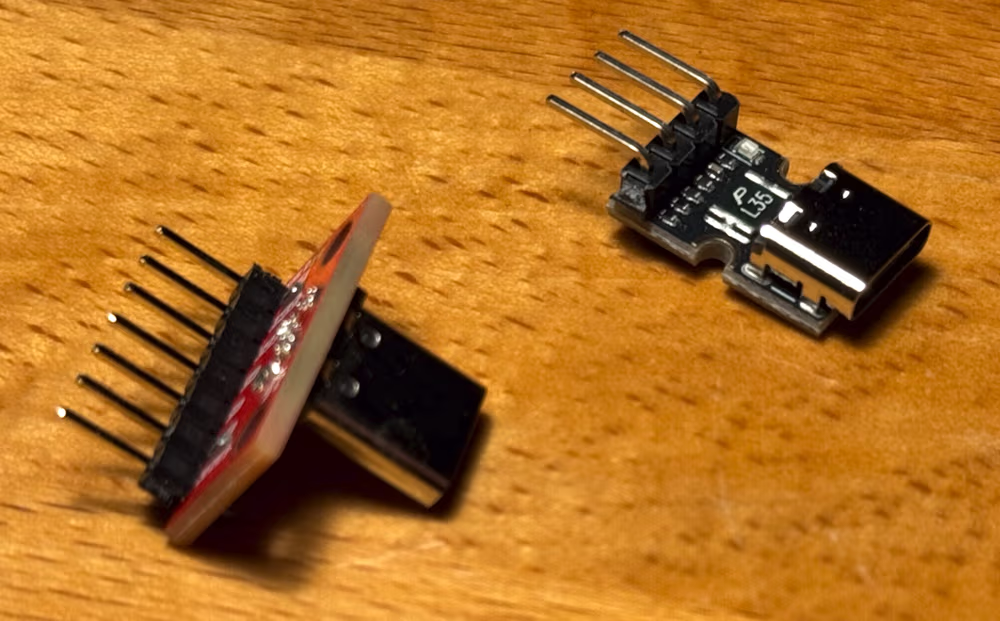
I used the one with the red PCB because I needed the port to reach outside the box. And the little one was too cute not to get it
I also wanted to know how much power my device would draw. For this, I have used a USB tester. This is whole test setup:15
Power usage testing
And here are the test runs.
To summarize:
- The microcontroller draws 36 mA at 5V on its own. This is quite high, compared to other microcontrollers. The Teensy is also running at 24 MHz here (can’t go slower), not the default 600 MHz, at which it consumes 100 mA.
- The CO₂ sensor adds 4 mA during its warm-up phase. It jumps to over 90 mA for a moment during the measurement.
- The PM sensor fan draws 60 mA for half a minute. This is in line with what the datasheet specifies.
- The eink refresh draws 4 mA.
This averages out to about 70 mA. If you were to use a 2000 mAh battery, it would last a little over a day.16 Not great, not terrible. The 24 MHz the Teensy is running at is way too much for what it’s doing here, and you could go much lower than the 36 mA with another microcontroller. But all the sensors use fans and lasers, and those dominate the power consumption, so you’d have to reduce the number of measurements you take.
Doesn’t matter too much, my device is meant to be used with a USB power brick anyway. And hey, it only uses 0.35 watts of power.
Package Link to heading
All this electronic stuff is relatively simple compared to product packaging. I suppose a 3D printer would come in handy here, but I don’t have one. Instead, I used a sturdy Pelikan fountain pen box made out of cardboard and held closed with a magnet. The box felt way too big compared to the size of the screen, but I had nothing smaller I could use.
You put your components in, take a rough measurement of where they all need to go, then you get a knife and cut, cut, and cut again, hoping not to cut yourself.
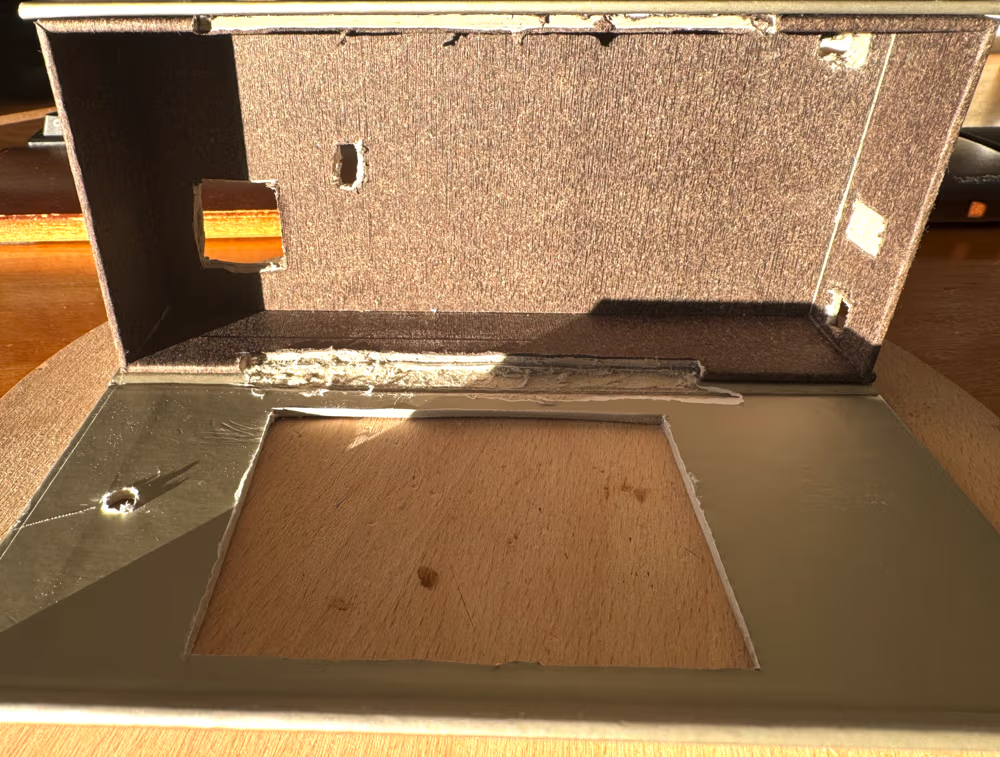
Box with all necessary holes
Then it’s hot glue time!
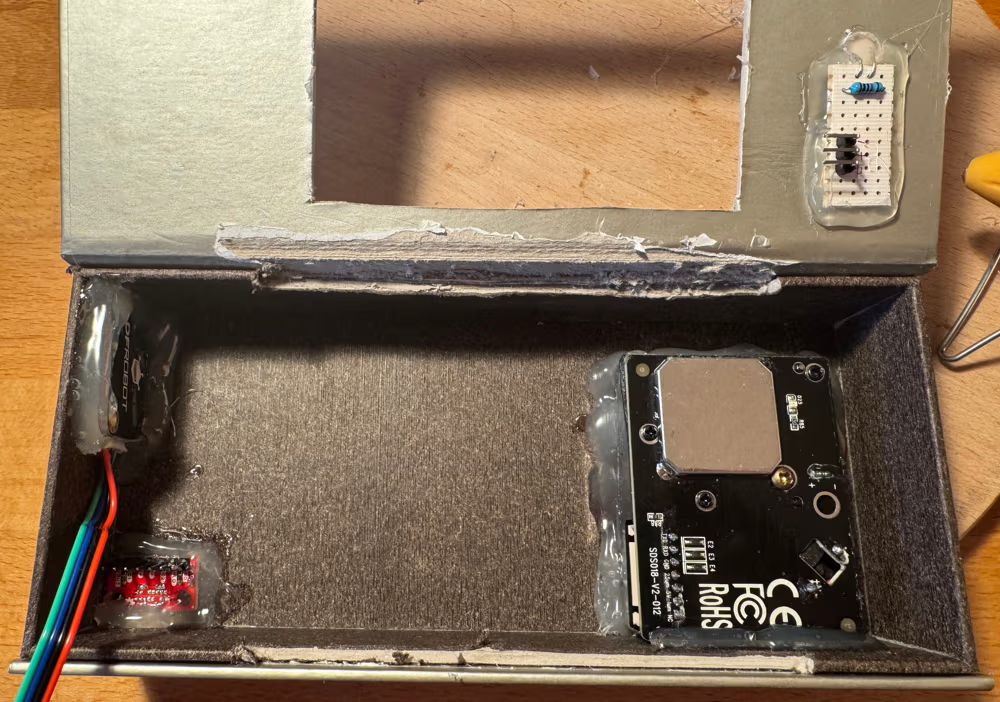
Sensors and power supply glued in
The clearance problems return as I can’t get the circuit board into place. I have to cut through the glue I just put in to make the board flush with the rear wall.
Main board glued in
Then again! This time the pinout of the light sensor interferes with the display. Time for some last minute fixes.
Some manual fine-tuning
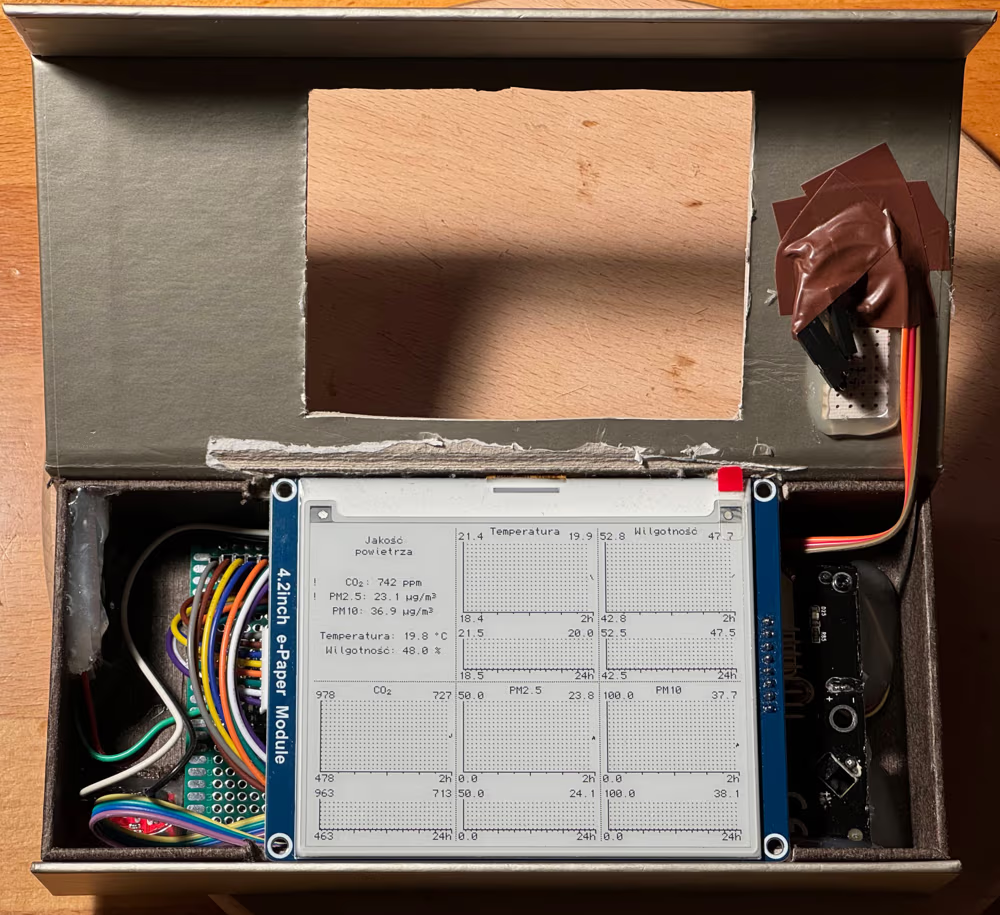
Now it’s time to connect everything. Suddenly the previously spacious box starts to feel very cramped.
Sensor connections made
The last thing to plug in is the eink module. There is really almost no space left inside to fit all these cables and their connectors.
Display unit connected
The display is not glued in, as that would block access to the microcontroller if I wanted to update the firmware or take it out for another project. It also doesn’t need to be glued, as it fits tightly into the cut-out.
Display in place
And that’s it. The air monitor is ready and can be plugged in to do its work.
Here you can also see some final touches to the firmware. The dividing lines are dotted to make them fainter. An average value is displayed in the upper right corner of the graphs. The time range of each graph is printed in the lower left corner. Sensor readings provide a four-tiered warning when limits are exceeded.
Memory considerations Link to heading
The final firmware compiles as follows:
Memory Usage on Teensy 4.0:
  FLASH: code:82260, data:14520, headers:8688   free for files:1926148
   RAM1: variables:43136, code:80088, padding:18216   free for local variables:382848
   RAM2: variables:128  free for malloc/new:524160
The frame buffer requires 15K of RAM. The bit-order-reversal LUT is 256 bytes. The font is 640 bytes. The dark mode image is 288 bytes.
There are 15 instances of std::vector that probably bloat all of the code and data size numbers because these data structures require a way to somehow allocate the memory, and for the most part you can just go without that functionality. These vectors could be replaced by fixed-size tables (about 5 KB total, or 2.5 KB if you really want), but I couldn’t be bothered.
Hmm, let’s do a quick test, shall we?
An empty program compiles to:
Memory Usage on Teensy 4.0:
  FLASH: code:7796, data:1992, headers:8640   free for files:2013188
   RAM1: variables:14720, code:6016, padding:26752   free for local variables:476800
   RAM2: variables:128  free for malloc/new:524160
Adding analogRead(A1); line to the loop() function results in:
Memory Usage on Teensy 4.0:
  FLASH: code:7972, data:3016, headers:8464   free for files:2012164
   RAM1: variables:15744, code:6192, padding:26576   free for local variables:475776
   RAM2: variables:128  free for malloc/new:524160
Now let’s add a global std::vector<float> a; and replace the analog read line with a.emplace_back(analogRead(A1));.
Memory Usage on Teensy 4.0:
  FLASH: code:70276, data:11208, headers:8624   free for files:1941508
   RAM1: variables:24800, code:68488, padding:29816   free for local variables:401184
   RAM2: variables:128  free for malloc/new:524160
Oh.
Bill of materials Link to heading
The Milesight AM319 air quality monitor, which was the only commercial eink device that would draw a (lousy) graph, costs about 1200-1300 zł. How much would you have to pay to make your own device like I did? Let’s say you’re willing to order from AliExpress.
- You should be able to fit with the firmware on the STM32 Bluepill, which goes on for about 4 zł on AliExpress. It’s likely a counterfeit, but who cares. You would have to lose the memory hungry std::vector, but that’s not a big problem. Well, actually, the Blackpill goes for the same dirt cheap price, so whatever.
- The SCD41 CO₂ sensor can go for as low as 40 zł.
- You can find the SDS011 PM sensor for 60 zł (the SDS018 seems to be discontinued).
- The Waveshare eink display goes for 120 zł.
In total, that’s 224 zł for all the parts. That’s about the price of the most basic bargain bin air quality monitor, which gives you only the PM 2.5 reading (who knows how accurate it is) and only the current value, often with an archaic 7-segment display.
Is it possible to learn this power? Link to heading
I never understood electronics.
The high school stuff, as far as I can remember, and I don’t remember much, was about resistors in series and resistors in parallel and how those two configurations are different. And then some other completely unrelated stuff came in, because that’s the way it goes.
The university courses went full throttle into the theory, assuming that everyone knows what it’s all about and has the necessary practice. In a group of 150, only 2 people had that knowledge. We were simulating characteristic responses of diodes, or calculating the equivalent resistance of a resistor network. It was a colossal waste of time and not meant to teach anyone anything.
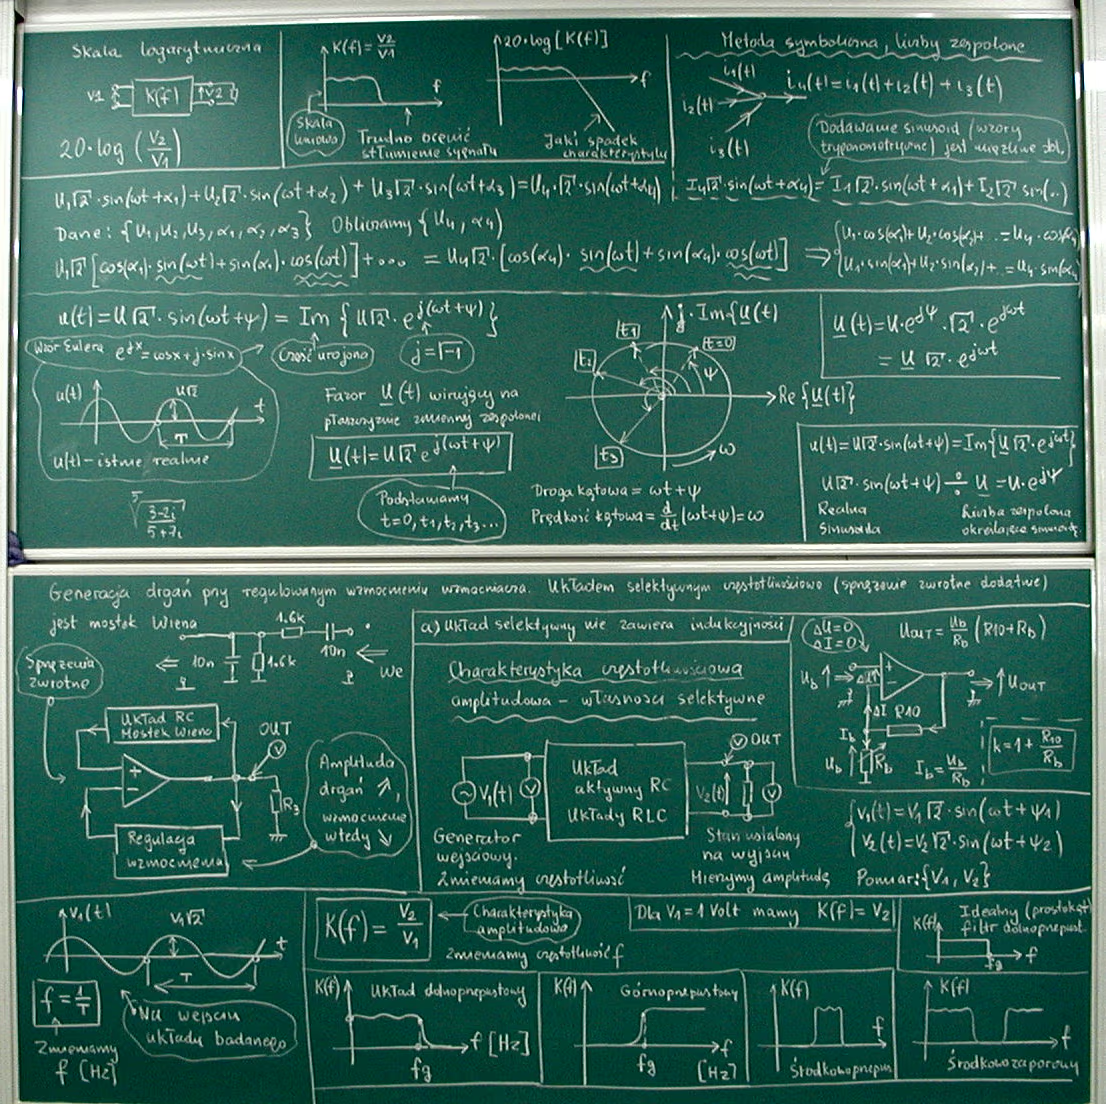
WTF is this shit, and why are there sexist jokes about women all the time?
I learned everything later on my own. I used an online course that was originally published in a print magazine. The course is now available on the author’s website, hopefully in a revised version with all the mistakes corrected. It’s in Polish, so you’ll probably want something else.
The course focused on the practical aspects, starting each lesson with a circuit that did something interesting that you had to build on the breadboard. Then it went on to explain how it worked, covering all the advanced topics along the way. This is how you are supposed to learn things.
As for microcontrollers, a month ago I knew nothing about them.
When you are used to dealing with all the modern crap like Vulkan or Wayland, or figuring out how to solve locks in your multithreaded code, the experience is surprisingly refreshing. I had all the graphing done in less time than it took me to process and understand the bullshit documentation of Wayland’s clipboard protocol. Soldering is relaxing. Gluing things into a box is fulfilling. Seeing your simple code changes do something different on that little screen connected to that little PCB with a bunch of wires has all the lost magic of your first interaction with the computer. There is no operating system to worry about. There is no network. There’s consideration for how much memory you’re using and how big your program is. There are no updates.
It feels nice.
The concept of measuring latency was not new to me, but when I first read about it a long time ago, it was out of my grasp. ↩︎
Technically, this is a development board. The microcontroller is just the chip. ↩︎
Can you find a cheaper microcontroller that will do the job? Probably yes. But is it worth getting some random hardware when the general opinion is that Teensy is pretty great and it’s basically one guy’s passion project? Probably not.17 ↩︎
One time I showed someone a photo of a miniature figure I had painted. “Yeah, cool, cool.” Then, after some time: “Oh shit, that’s a lighter! I thought it was a spray paint can. Is it really that small?” Well, yes, it is. ↩︎
By “screen content changing” I mean, of course, that there’s a change in the light levels that the monitor actually emits. There are (quite recent) terminal emulator latency benchmarks on the web, where the measurements were all done in software, by taking screenshots. That’s… yeah… well. ↩︎
Looking more closely at the module, I don’t think there’s a proper datasheet for it anywhere. You know, the thing that would tell you that the photoresistor has a response time range of 20 to 30 ms. Which would make it not really a good fit for measuring the latency of a monitor. ↩︎
My inner child just loves that name. ↩︎
Okay, not really. I bought it at a different store. Okay, not really. I ordered the SDS011 sensor from another store. But they sent me the SDS018. Which they’re not even selling.18 So, with that out of the way, let’s pretend this didn’t happen and just go with the simplified story in the main text. ↩︎
There is also an analog PWM output, but I am not interested in that. ↩︎
Move the output line and the resistor between the power line and the collector terminal (the resistor separates the output from the power supply), and you have the NOT logic gate! ↩︎
Yes, that’s three different devices, and three different serial port interfaces. ↩︎
And what I tried could potentially damage the screen. In my little experimentation I saw problems with the contrast fading, or burn-in of contents, where even the full-screen refresh (the long flickering one) didn’t made things better. Fortunately, these problems went away after some time. ↩︎
A fun exercise: what’s the fastest way to do this? Before you get too far with it, this is a microcontroller, it can do memory access in one cycle, so just use a LUT. ↩︎
Remember to use some kind of hysteresis when setting up such a system, or you will get ping-pong. ↩︎
The light sensor is not connected here. We can calculate its maximum power consumption using Ohm’s law, which tells us that with the 3.3V power supply, the 10K resistor (assuming a zero resistance photoresistor) will limit the current to 0.33 mA, or 1.1 mW. ↩︎
You would also have to convert the battery voltage to the 5V that the Teensy needs, which would cause an additional loss of power. ↩︎
Teensy 4.0 costs ~150 zł and gives you a lot of room to experiment. In comparison, the Arduinos are cheaper, but look quite lacking. For example, the Arduino Nano Every (this is the cheap one) costs 70 zł, but offers only 48 KB of program flash memory and 6 KB or RAM to operate in. This is just not enough for my firmware. On the other hand, the STM32 boards like BlackPill, look quite interesting. They are cheap (34 zł) and have half a megabyte of flash ROM and 128 KB of RAM, along with a nice collection of I/O pins. For smaller projects,20 the BluePill for 20 zł seems to be a superior alternative to the Arduino, as it has 64 KB of flash and 20 KB of memory. ↩︎
Dave Jones of the EEVBlog liked to use the phrase “they got whatever chip was cheapest on the Shenzhen market today”. It now makes all the sense.19 ↩︎
As you may know, I do have a Blu-ray drive. Some time ago I have bought a new PC case, one that does not have any drive bays (who uses them these days, ha, ha). I figured I could just buy a USB device that plugs into the SATA port on a hard drive or the disc drive. So I found one that the reviews specifically said would work with a DVD or Blu-ray drive. When it arrived, it turned out that it does not. Different chip inside, I did not win the lottery that day. Now I have a “slim” USB Blu-ray drive. It works, but not very well. ↩︎
Maybe “smaller” is not the right word here. For the air monitor I am making, I need 15 KB of RAM to store the entire 400×300 pixel screen. But this is just a convenience, and I could just as easily work on a much smaller sub-region of the screen and upload each region separately. This would greatly reduce the amount of RAM I need, while only slightly increasing the size of the program. ↩︎